Author Archive
 Weekly Propagation Summary – 2015 Apr 13 16:10 UTC
 April 13th, 2015 |
  Author:
Here is this week’s space weather and geophysical report, issued 2015 Apr 13 0314 UTC.
Highlights of Solar and Geomagnetic Activity
06 – 12 April 2015
Solar activity was at low to moderate levels throughout the period.
Region 2320 (S12, L=211, class/area=Dac/180 on 07 Apr) produced an
M1/1b flare at 1443 UTC on 08 April and Region 2321 (N13, L=094,
class/area=Ekc/610 on 12 Apr) produced a long-duration M1/Sf flare
at 0950 UTC on 12 April, which were the largest events of the
period. In addition to the R1 (Minor) radio blackouts, Regions 2320
and 2321 produced numerous low to mid-level C-class flares
throughout the week and were the most productive active regions of
the period. A coronal mass ejection (CME) associated with the M1/Sf
flare from Region 2321 was first observed in SOHO/LASCO C2
coronagraph imagery at 0948 UTC on 12 April, but was directed well
east of the Sun-Earth line.
Region 2320 produced a C3/1f flare at 1906 UTC on 06 April, with
associated Type-II and Type-IV radio emissions, which resulted in a
CME that was visible in coronagraph imagery beginning at 1936 UTC on
06 April. This CME impacted Earth early on 10 April, causing periods
of moderate geomagnetic storms. See "Geomag" portion below
for further information.
Toward the end of the period, Region 2320 produced a C6/Sf flare at
2329 UTC on 12 April with associated Type-II radio emissions. A
subsequent coronal mass ejection (CME) was first visible in
SOHO/LASCO C2 coronagraph imagery at 12/2348 UTC but analysis is
ongoing to determine if this event has an Earth-directed component.
No proton events were observed at geosynchronous orbit.
The greater than 2 MeV electron flux at geosynchronous orbit reached
moderate levels on 06-09 April and at normal levels for the
remainder of the period.
Geomagnetic field activity was at quiet to unsettled levels for
06-09 April under a nominal solar wind regime. The 06 April CME
impacted Earth just after 0000 UTC on 10 April, enhancing the
geomagnetic field. As the 06 April CME passed the Earth, 10 April
began with periods of G1 (Minor) geomagnetic storm conditions
between 0000-0300 UTC and 0600-0900 UTC and an isolated period of G2
(Moderate) geomagnetic storm period between 10/0300-0600 UTC. Active
conditions were observed between 10/0900-1500 UTC with quiet to
unsettled levels observed over the remainder of 10 April. Active
conditions were observed once again for the first half of 11 April
as residual CME effects continued to subside but the latter half of
11 April was quiet to unsettled. Quiet conditions were observed on
12 April.
Forecast of Solar and Geomagnetic Activity
13 April – 09 May 2015
Solar activity is likely to be at moderate (R1-R2/Minor-Moderate)
levels throughout the period, with the exception of 25-26 April, due
to the flare potential of Regions 2320 (S12, L=211) and 2321 (N13,
L=094).
No proton events are expected at geosynchronous orbit, barring any
significant flare activity.
The greater than 2 MeV electron flux at geosynchronous orbit is
expected to reach high levels on 21-24 April and 04-09 May, moderate
levels on 17-20, 25-28 April, and 01-03 May, and normal levels for
the remainder of the period.
Geomagnetic field activity is expected to be at G1 (Minor)
geomagnetic storm levels on 17 and 30 April with active conditions
expected for 16, 25, 29 April and 01 May, all due to coronal hole
high speed stream effects. Quiet to unsettled field activity
expected for the remainder of the period.
Don’t forget to visit our live space weather and radio propagation web site, at: http://SunSpotWatch.com/
Live Aurora mapping is at http://aurora.sunspotwatch.com/
If you are on Twitter, please follow these two users:
+ https://Twitter.com/NW7US
+ https://Twitter.com/hfradiospacewx
Get the space weather and radio propagation self-study course, today. Visit http://nw7us.us/swc for the latest sale and for more information!
We’re on Facebook: http://NW7US.us/swhfr
Weekly Propagation Summary – 2015 Apr 06 16:10 UTC
Here is this week’s space weather and geophysical report, issued 2015 Apr 06 0133 UTC.
Highlights of Solar and Geomagnetic Activity
30 March – 05 April 2015
Solar activity was at low levels throughout the period. Region 2303
(N19, L=066, class/area=Hkx/400 on 17 Mar) produced low to mid-level
C-class activity early in the period while Regions 2318 (N10, L=199,
class/area=Dao/199 on 05 Apr) and 2320 (S12, L=212,
class/area=Dai/140 on 05 Apr) each produced only low-level C-class
flare activity throughout the remainder of the period.
A filament eruption centered near S29E28 was observed in SDO/AIA 193
imagery between 04/2225-2330 UTC. A long-duration C3/1f hyderflare
was measured during this event and had an associated Type-II radio
emission. The subsequent fast-moving coronal mass ejection (CME) was
first observed in SOHO/LASCO C2 coronagraph imagery beginning at
04/2336 UTC. WSA-ENLIL model output suggests a glancing blow arrival
of this CME late on 07 April.
No proton events were observed at geosynchronous orbit.
The greater than 2 MeV electron flux at geosynchronous orbit was at
normal levels on 30 Mar and normal to moderate levels on 31 Mar-05
Apr.
Geomagnetic field activity was at quiet to unsettled levels on 02-04
Apr with an isolated period of active conditions observed between
2100-2359 UTC on 02 Apr due to the effects of a positive polarity
coronal hole high speed stream. Quiet to unsettled levels were
observed on 30 Mar-01 Apr, and 05 Apr under a mostly nominal solar
wind environment.
Forecast of Solar and Geomagnetic Activity
06 April – 02 May 2015
Solar activity is expected to be low (below NOAA Scale event
thresholds) with a slight chance for M-class (R1-Minor) flare
activity throughout the outlook period.
No proton events are expected at geosynchronous orbit.
The greater than 2 MeV electron flux at geosynchronous orbit is
expected to reach high levels on 22-24 Apr and 02 May, moderate
levels on 06-08, 11-14, 17, 20-21 Apr, and 27 Apr-01 May, and at
normal levels for the remainder of the period.
Geomagnetic field activity is expected to be at G1 (Minor)
geomagnetic storm levels on 15-16, 18-19, and 25-27 Apr due to
coronal hole high speed stream effects. Active conditions are
expected on 07-09 Apr due to the anticipated arrival of the 04/05
Apr CME. Active conditions are expected on 17, 20 Apr, and 28 Apr-01
May due to coronal hole high speed stream effects with generally
quiet to unsettled levels likely for the remainder of the period.
Don’t forget to visit our live space weather and radio propagation web site, at: http://SunSpotWatch.com/
Live Aurora mapping is at http://aurora.sunspotwatch.com/
If you are on Twitter, please follow these two users:
+ https://Twitter.com/NW7US
+ https://Twitter.com/hfradiospacewx
Get the space weather and radio propagation self-study course, today. Visit http://nw7us.us/swc for the latest sale and for more information!
We’re on Facebook: http://NW7US.us/swhfr
Today’s Space Weather Forecast Discussion (2015 Mar 31 1230 UTC)
Here is the current forecast discussion on space weather and geophysical activity, issued 2015 Mar 31 1230 UTC.
Solar Activity
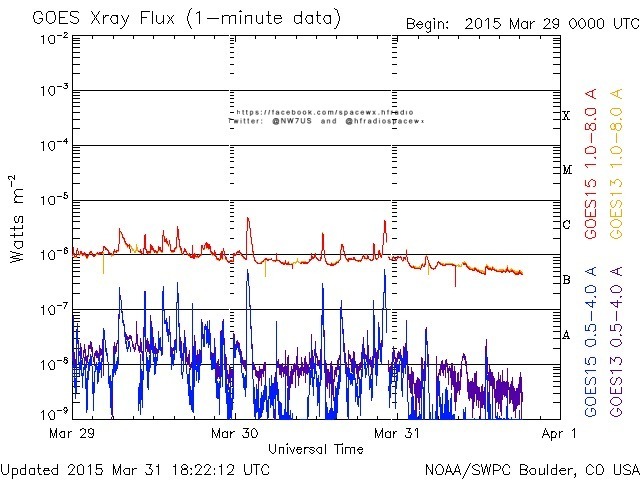
24 hr Summary: Solar activity was at low levels with C-flare activity from both Regions 2303 (N18, L=065) and 2305 (S10W58, Dho/beta). The largest flare of the period was a C4 at 30/2205 from Region 2303 just beyond the NW limb. Slight decay was observed in the leading spots of Region 2315 (S20W36, Dro/beta) and the trailing spots in Region 2305. No Earth-directed coronal mass ejections were observed.
Forecast: Solar activity is likely to be at low levels with a slight chance for an isolated M-class (R1-R2, Minor-Moderate) flare for day one (31 Mar). An increased chance for M-class activity is expected by days two and three (01-02 Apr) as old Regions 2302 (N12, L=189) and 2297 (S17, L=196) are expected to return.
Energetic Particle
24 hr Summary: The greater than 2 MeV electron flux at geosynchronous orbit was at normal levels. The greater than 10 MeV proton flux at geosynchronous orbit remained at background levels.
Forecast: The greater than 2 MeV electron flux at geosynchronous orbit is forecast to be at normal to moderate levels all three days (31 Mar -02 Apr) The greater than 10 MeV proton flux at geosynchronous orbit is expected to be at or near background conditions (Below S1-Minor) for the forecast period.
Solar Wind
24 hr Summary: Solar wind speed at the ACE spacecraft for the majority of the period was in the mid-300 km/s range but increased to near 400 km/s after 0730 UTC. Phi was negative. Bz was at or above -4 nT and Bt was less than 7 nT through 0730 UTC when it increased to near 16 nT. The increase in activity is likely due to the onset of a coronal hole high speed stream (CH HSS).
Forecast: Continued enhancement of solar wind parameters is anticipated on day one (31 Mar) and remain enhanced through day three (02 Apr) as the CH HSS becomes geoeffective.
Geospace
24 hr Summary: The geomagnetic field was at quiet levels.
Forecast: Unsettled to active conditions are expected to dominate through day three (02 Apr) due to CH HSS effects. trans-equatorial high speed stream becomes geoeffective.
Don’t forget to visit our live space weather and radio propagation web site, at: http://SunSpotWatch.com/
Live Aurora mapping is at http://aurora.sunspotwatch.com/
If you are on Twitter, please follow these two users:
+ https://Twitter.com/NW7US
+ https://Twitter.com/hfradiospacewx
Get the space weather and radio propagation self-study course, today. Visit http://nw7us.us/swc for the latest sale and for more information!
We’re on Facebook: http://NW7US.us/swhfr
Today’s Solar and Geophysical Activity (2015 Mar 31 18:30 UTC)
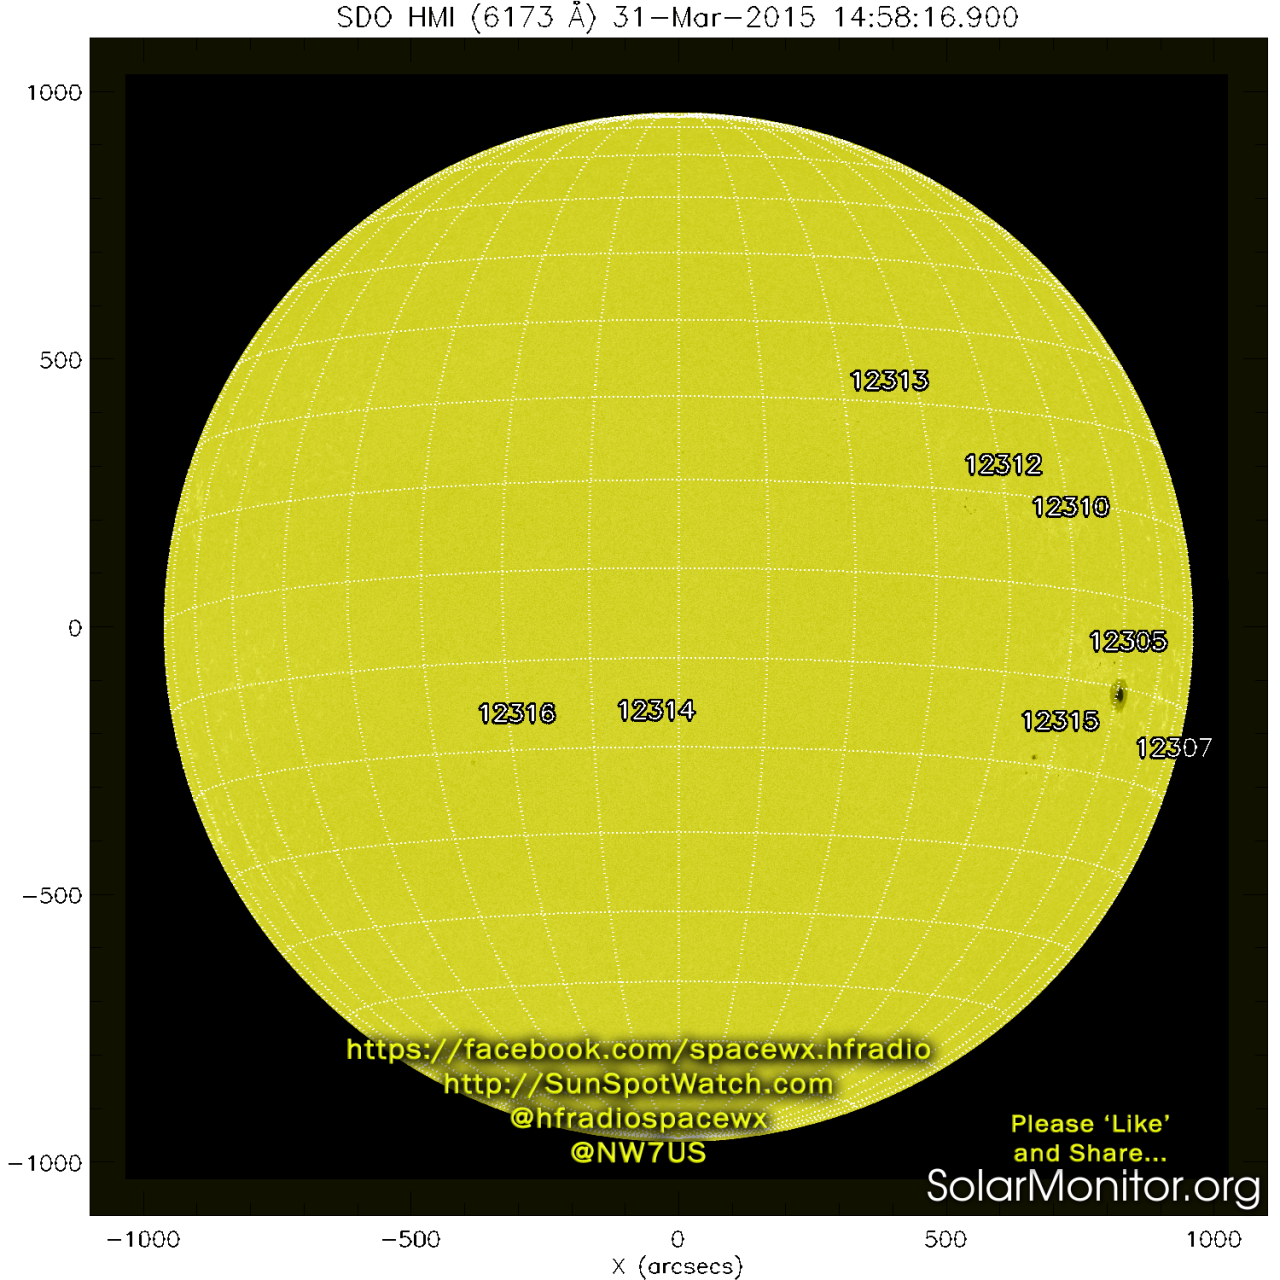
Daily solar report: Current Sunspot Cycle 24 Activity and Space Weather
Sunspot count: Sun Spots: 56 as of 03/30/2015
10.7-cm Radio Flux: 134 SFU (SFU=Solar Flux Units)
Estimated Planetary A-index (Ap): 5 | K-index (Kp): 2
Solar Wind: 405 km/s at 16.0 protons/cm3, Bz is 2.0 nT
(Mar 31, 2015 at 1820 UT)
X-ray Solar Flares:
6h hi [C4.7][0138Z 03/30] 24h hi [C4.7][0138Z 03/30]
Background X-ray Level, Last Six Days
Mar 30 2015 :: B6.6
Mar 29 2015 :: B9.1
Mar 28 2015 :: B7.9
Mar 27 2015 :: B5.0
Mar 26 2015 :: B4.5
Mar 25 2015 :: B5.4
Global HF Propagation Conditions for 1800Z on 31 Mar, 2015
High Latitude: Fair
Middle Latitude: Normal
Low Latitude: Normal
Geomagnetic Latitude Ranges: High: 60-90 degrees, Middle: 20-60 degrees, Low: 0-20 degrees
For live data and images, visit http://SunSpotWatch.com
Get the space weather and radio propagation self-study course, today. Visit http://nw7us.us/swc for the latest sale and for more information!
This report has been prepared by your space weather and radio propagation reporter, Tomas ( amateur radio operator, NW7US, http://NW7US.us )
We’re on Facebook: http://NW7US.us/swhfr
Today’s Plot-Graph of Solar, Ionospheric, and Geomagnetic Indices (31 March 2015)
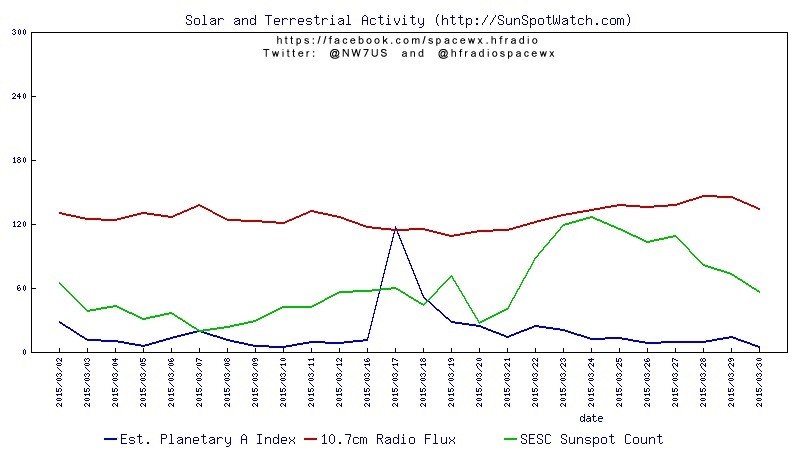
Today’s graph, plotting the SESC sunspot number, the 10.7cm Radio Flux, and the Estimated Planetary A Index, for the last 30 days.
The numbers are:
Date | Sunspots | 10.7-cm Flux | Ap
==========================================
2015/03/30 | 56 | 134 | 5
2015/03/29 | 73 | 145 | 14
2015/03/28 | 82 | 146 | 9
2015/03/27 | 109 | 138 | 9
2015/03/26 | 103 | 136 | 8
2015/03/25 | 115 | 138 | 13
2015/03/24 | 127 | 133 | 12
2015/03/23 | 119 | 128 | 21
2015/03/22 | 88 | 122 | 24
2015/03/21 | 40 | 114 | 14
2015/03/20 | 27 | 113 | 24
2015/03/19 | 71 | 109 | 28
2015/03/18 | 44 | 115 | 52
2015/03/17 | 60 | 114 | 117
2015/03/16 | 57 | 117 | 11
2015/03/12 | 56 | 127 | 8
2015/03/11 | 42 | 132 | 9
2015/03/10 | 42 | 121 | 5
2015/03/09 | 29 | 123 | 6
2015/03/08 | 23 | 124 | 11
2015/03/07 | 20 | 138 | 20
2015/03/06 | 37 | 127 | 13
2015/03/05 | 31 | 130 | 6
2015/03/04 | 43 | 124 | 10
2015/03/03 | 38 | 125 | 11
2015/03/02 | 65 | 130 | 28
For complete live data and images visit http://SunSpotWatch.com
Be sure to share this post, to spread the love!
We’re on Facebook: http://NW7US.us/swhfr
Today’s Sun Seen at the 304-Angstrom Wavelength (30 March 2015)
Today’s Sun (artificially-colored in red) seen at the 304-angstrom wavelength (Extreme Ultraviolet, or EUV), as viewed by the Solar Dynamics Observatory (SDO), by the Atmospheric Imaging Assembly (AIA).
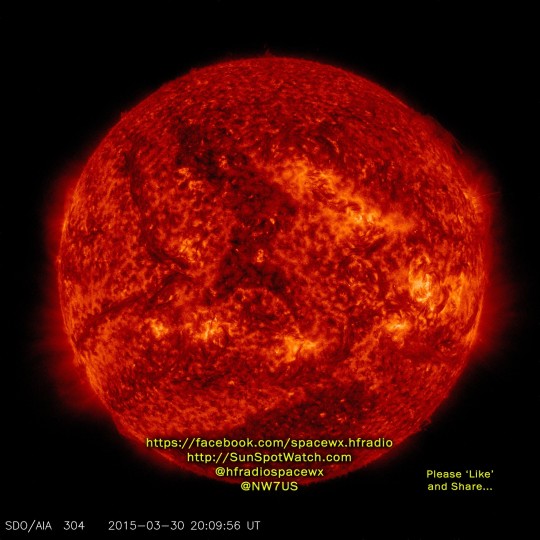
At this wavelength, at a wavelength not seen by the un-aided eye, we can see the Sun through the 30.4 nm (304 A) filter. This Extreme Ultraviolet (EUV) waveband is used to monitor the chromosphere and lower transition region. It is useful to see plasma and filament activity, including filamet eruptions and coronal mass ejections (CMEs).
The image is a “false color image”, meaning that observed data are in a range outside of what human eyes can see, so the data are digitally recast into colors that emphasize physically important features. This view is created from data gathered by the Solar Dynamics Observatory (SDO) satellite that flies above Earth”s atmosphere in an inclined geosynchronous orbit.
Emissions captured in this image come from helium (He), the second most abundant element in the solar atmosphere. Singly ionized Helium (He II) emits Extreme Ultraviolet (EUV) light when heated to temperatures of ~70,000 deg K. In the upper solar atmosphere the temperatures are so high that most chemical elements have lost many of their electrons. The remaining electron, which is still attached to the atom, emits EUV radiation in narrow wavebands or lines when it is in an excited state.
The 30.4 nm filter (also called channel or bandpass) is dominated by emissions from singly (once) ionized helium which has missing 1 electron–He II. The roman numeral descriptor is consistent with spectral notation: the level of ionization for a given roman numeral is one unit larger that the actual number of missing electrons. The temperatures associated with this level of ionization is range from 6 x 10^4 K to 8 x 10^4 K.
The bright regions in this image correspond to regions of closed magnetic field loops that trap the hot, emitting plasma. Large bright regions are often called active regions. The dark regions correspond to cooler temperatures and possibly to locations where magnetic field lines open into the heliosphere, and thus, do not trap hot plasma.
View live data and images at http://SunSpotWatch.com
Get the space weather and radio propagation self-study course, today. Visit http://nw7us.us/swc for the latest sale and for more information!
We”re on Facebook: http://NW7US.us/swhfr
January Special Event – Straight Key Century Club and K3Y/0
All month long, during January 2015, a group of volunteers using the special event callsign, “K3Y” with a slant-region number (i.e., “K3Y/3” or “K3Y/0”), were on the amateur radio HF bands (and some, on six meters). I was one of these volunteers, operating nearly every day of the month for at least one hour, but some times a few hours per day.
“K3Y,” the Straight Key Century Club’s annual January celebration, commemorates the club’s founding in 2006 following the American Radio Relay League’s Straight Key Night. A small group of participants wanted to extend the fun of SKN throughout the year. The SKCC is the result.
For the first three years, the club’s founders used K1Y, K2A, and K3Y as the celebration’s special-event calls. But someone cleverly noticed that a 3 is nothing more than a backwards, curvaceous E. This “KEY” event has operated under the K3Y call ever since.
The on-air party is open to members and non-members alike. It runs from 0000 UTC Jan. 2 through 2359 UTC Jan. 31. It’s a great time to introduce others to the joys of hand-crafted Morse code using straight keys, bugs, and side swipers.
In this video, you can see this operation at my ham radio shack, as I am the control operator of the special event station, “K3Y/0”, during one of the many shifts. “K3Y” is the special event callsign of the Straight Key Century Club (SKCC). The special event operates each January.
In the following video, you can see some of the QSL cards associated with this year’s operation, and then some other QSL cards in my collection.
https://www.youtube.com/watch?v=gOsNjT7OCyc
+ The SKCC website is at http://skccgroup.com
+ The “K3Y” special event page is http://www.skccgroup.com/k3y/index.php
+ My page is at http://NW7US.us
+ My Morse code page is http://cw.hfradio.org