Posts Tagged ‘Sun’
 Thirty Minutes of Dazzle: The Sun in UHD 4K by SDO (NASA)
Take a front-seat view of the Sun in this 30-minute ultra-high definition movie in which NASA SDO gives us a stunning look at our nearest star.
This movie provides a 30-minute window to the Sun as seen by NASA’s Solar Dynamics Observatory (SDO), which measures the irradiance of the Sun that produces the ionosphere. SDO also measures the sources of that radiation and how they evolve.
SDO’s Atmospheric Imaging Assembly (AIA) captures a shot of the sun every 12 seconds in 10 different wavelengths. The images shown here are based on a wavelength of 171 angstroms, which is in the extreme ultraviolet range and shows solar material at around 600,000 Kelvin (about 1 million degrees F.) In this wavelength it is easy to see the sun’s 25-day rotation.
The distance between the SDO spacecraft and the sun varies over time. The image is, however, remarkably consistent and stable despite the fact that SDO orbits Earth at 6,876 mph and the Earth orbits the sun at 67,062 miles per hour.
Scientists study these images to better understand the complex electromagnetic system causing the constant movement on the sun, which can ultimately have an effect closer to Earth, too: Flares and another type of solar explosion called coronal mass ejections can sometimes disrupt technology in space. Moreover, studying our closest star is one way of learning about other stars in the galaxy. NASA’s Goddard Space Flight Center in Greenbelt, Maryland. built, operates, and manages the SDO spacecraft for NASA’s Science Mission Directorate in Washington, D.C.
Charged particles are created in our atmosphere by the intense X-rays produced by a solar flare. The solar wind, a continuous stream of plasma (charged particles), leaves the Sun and fills the solar system with charged particles and magnetic field. There are times when the Sun also releases billions of tons of plasma in what are called coronal mass ejections. When these enormous clouds of material or bright flashes of X-rays hit the Earth they change the upper atmosphere. It is changes like these that make space weather interesting.
Sit back and enjoy this half-hour 4k video of our Star! Then, share. 🙂
73 dit dit
Stunning Ultra-HD View; Sun Timelapse 2015 NASA/SDO
This video is ten minutes of coolness.
This cool time-lapse video shows the Sun (in ultra-high definition 3840×2160 – 4k on YouTube) during the entire year, 2015. The video captures the Sun in the 171-angstrom wavelength of extreme ultraviolet light. Our naked, unaided eyes cannot see this, but this movie uses false-colorization (yellow/gold) so that we can watch in high definition.
The movie covers a time period of January 2, 2015 to January 28, 2016 at a cadence of one frame every hour, or 24 frames per day. This timelapse is repeated with narration by solar scientist Nicholeen Viall and contains close-ups and annotations. The 171-angstrom light highlights material around 600,000 Kelvin and shows features in the upper transition region and quiet corona of the sun.
The first half tells you a bit about the video and the Sun, and you can see the entire year 2015 rotate by. The second half is narrated by a NASA scientist. It is worth watching all ten minutes. And, then, sharing!
The sun is always changing and NASA’s Solar Dynamics Observatory is always watching.
Launched on Feb. 11, 2010, SDO keeps a 24-hour eye on the entire disk of the sun, with a prime view of the graceful dance of solar material coursing through the sun’s atmosphere, the corona. SDO’s sixth year in orbit was no exception. This video shows that entire sixth year–from Jan. 1, 2015 to Jan. 28, 2016 as one time-lapse sequence. Each frame represents 1 hour.
SDO’s Atmospheric Imaging Assembly (AIA) captures a shot of the sun every 12 seconds in 10 different wavelengths. The images shown here are based on a wavelength of 171 angstroms, which is in the extreme ultraviolet range and shows solar material at around 600,000 Kelvin (about 1 million degrees F.) In this wavelength it is easy to see the sun’s 25-day rotation.
During the course of the video, the sun subtly increases and decreases in apparent size. This is because the distance between the SDO spacecraft and the sun varies over time. The image is, however, remarkably consistent and stable despite the fact that SDO orbits Earth at 6,876 mph and the Earth orbits the sun at 67,062 miles per hour.

A blending of an entire year, 2015, of the Sun as seen by NASA SDO at EUV 171 Angstroms
Why This is Important
Scientists study these images to better understand the complex electromagnetic system causing the constant movement on the sun, which can ultimately have an effect closer to Earth, too: Flares and another type of solar explosion called coronal mass ejections can sometimes disrupt technology in space. Moreover, studying our closest star is one way of learning about other stars in the galaxy. NASA’s Goddard Space Flight Center in Greenbelt, Maryland. built, operates, and manages the SDO spacecraft for NASA’s Science Mission Directorate in Washington, D.C.
For us radio enthusiasts, the study of the Sun helps us understand the dynamics of radio signal propagation. And, that aids us in communicating more effectively and skill.
Thanks for sharing, voting, and watching. More information and live Sun content can be accessed 24/7 at http://SunSpotWatch.com
You can also get the Space Weather and Radio Propagation Self-study Course at http://SunSpotWatch.com/swc
Carrington Probabilities
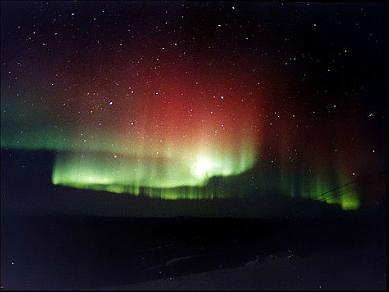
K7RA's 'Solar Update' in this week's ARRL News, mentions Jeff Foust's recent article in 'The Space Review', reminding us again of the dangers posed by a modern-day 'Carrington Event', also known as the 'Solar Storm of 1859'. A large solar flare in late August, hurled a monster-sized CME towards earth, making the 93 million mile journey in just 17.6 hours compared with the more normal rate of several days.
Huge auroras soon lit up the sky as far as central Mexico, Hawaii and the Caribbean. The aurora was so bright, it was reported that Rocky Mountain goldminers awoke in the middle of the night, and thinking morning had arrived, started to prepare breakfast. Telegraph lines and equipment burst into flame while some circuits continued to be usable with power supplies completely disconnected. The 1859 event still remains the most geoeffective solar storm since records have been kept.
Such an event today, of course, would wreak much more havoc ... probably having devastating consequences for decades and causing trillions of dollars of damage.
From Foust's article:
Was that, though, just a fluke event? .... Pete Riley, senior research scientist at Predictive Science Inc., offered a probabilistic forecast for the likelihood of another Carrington-like event, based on that storm’s estimated strength and measurements of the actual strength of solar storms over the last few decades. “If you the (sic) time between events, you can calculate the probability of the next event occurring within some unit of time,” he explained.
His estimate of the probability of another Carrington event is surprisingly high: about a 10 percent chance of such an event occurring over the next decade. “Ten percent is very, very high,” said William Murtaugh, assistant director for space weather at the White House’s Office of Science and Technology Policy (OSTP) ... “A one-percent probability over the course of the next one hundred years of a storm with an impact of that magnitude is considered very, very high and will motivate action.”
Interestingly, for this prediction, the actual strength of the solar storm of 1859 can only be estimated. If it was actually twice as strong as thought, then the probabilities drop from a (decade) 10% probability to just a 1% chance.
The U.S. government has recently set up a NASA multi-million budget funding proposal to study the likely effects of future large scale impacts and possible “response and resiliency capabilities” but it's not known if these will carry over to any new administration.
“Fortunately in space weather there’s no real politics,” Murtaugh said. “Both sides of House, both sides of the Senate, Republicans and Democrats, are both keen to work together to do something about this issue.”
The article has brought some interesting 'food for thought' comments, among them:
It's a little funny about how much energy is being spent advocating human spaceflight for colonization and settlement as a means to save the species, but so little is being devoted to specific threats to the species, and to individuals in particular. I could get killed in an asteroidal impact or a severe geomagnetic storm, but sending a shipload of people to Mars sure isn't going to protect me.
I am a member of Infragard, which is dedicated to supporting efforts to protect us from risks to our electrical grid and other critical infrastructure. A novel "One Second After" by William R. Forstchen accurately illustrates the effects of a similar intentional attack on our grid and how it creates a cascading collapse of our society. Gas stations cannot pump gas, food rots in the stores, more food cannot be delivered to all the needed locations, and the people who know how to fix things cannot reach where they are needed and also starve to death. The result of a severe Carrington event with no effective preparation or protection for the giant transformers could thus cause most of our population to starve in a few months. This risk is about 1% to 0.5 % per year and is like having everyone playing Russian roulette once a year with 200 pistols where just one is loaded.
A modern day 'Carrington repeat' does indeed give pause for thought but perhaps the generally predicted upcoming 'grand solar minimum' will buy scientists some extra time to come up with solutions for what will eventually occur ... and, one more thing's for certain ... it'll be a heck of an aurora!
Aurora On The Move
A recent posting to the Pacific Northwest VHF Society's reflector brought my attention to an interesting article describing the southward migration of the auroral zone.
According to the research paper published in the Proceedings of the National Academy of Sciences, the earth's magnetic field is gradually growing weaker, thus affecting its interaction with the solar wind.
The paper indicates that our present, abnormally high magnetic field, forces this interaction (auroras) to higher latitudes and as the field strength gradually weakens to more long-term average levels, auroras will be seen further south than we have been used to. The field has already weakened by about 10% over the past two hundred years and will continue to do so. Apparently it's all related to the regular 'flipping' of our magnetic field, with the most 'recent' flip taking place about 780,000 years ago.
So what does this mean for radio amateurs? Probably not a lot, in the immediate future but the unwanted effects to disturbances in the geomagnetic field will eventually be felt further and further to the south. Radio propagation in southern British Columbia has always been particularly sensitive to even very small disturbances in the field, particularly on the LF and MF bands. I am constantly amazed at how regions only 150 miles to the south or southeast of me are so much less affected than here, in the southern fringes of the auroral zone. VE7's don't claim to be in radio's 'black hole' without good reason.
LF Improving
 |
| courtesy: http://sdo.gsfc.nasa.gov/ |
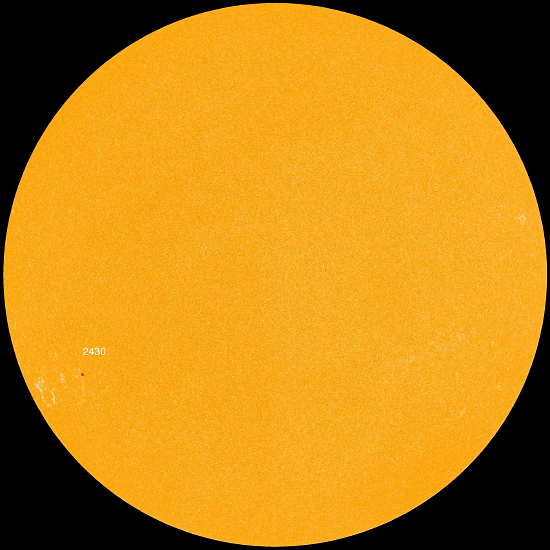
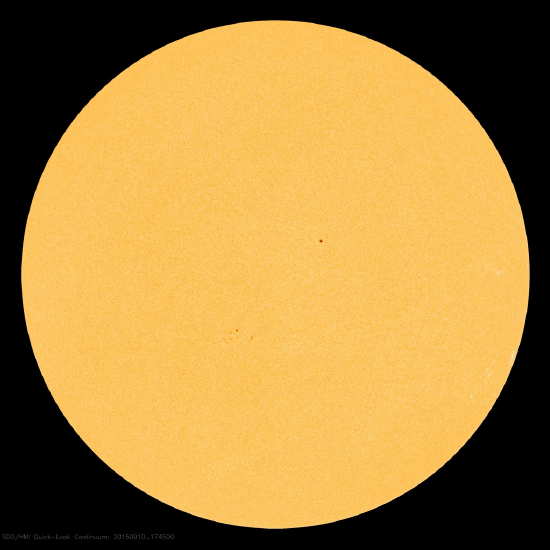
After more than a week of horrendous geomagnetic activity, due mainly to coronal-hole streaming, it looks as if things are starting to settle down once again. One would never know it from looking at the sun's image as the source of the streaming is largely invisible in the visible light spectrum. Viewing at a different wavelength however, reveals the source of the disruption, now about to rotate out of view for a few weeks.
| courtesy: http://sdo.gsfc.nasa.gov/ |
 |
| courtesy: http://wdc.kugi.kyoto-u.ac.jp/dst_realtime/presentmonth/index.html |
 |
| courtesy: http://www.noaa.gov/ |
Quiet Sun Not Enough
 |
| courtesy: http://sdo.gsfc.nasa.gov/ |
... the sun has been deathly quiet, as can be seen in yesterday's solar disk image.
It seems that just the 'normal' solar wind can disrupt things all on its own, without any solar flares or coronal mass ejections. In the late 70's, 'cracks' in the earth's magnetosphere were first observed... cracks that allowed even a quiet solar wind to actively interact with the earth's (normally protected) upper atmosphere. Apparently this is the present condition that has been disrupting normal propagation for the past many days.
The spaceweather.com web site has a nice explanation of how these cracks allow the Sun's Interplanetary Magnetic Field (IMF) to interact with the earth's field:
"Earth has a magnetic field, too. It forms a bubble around our planet called the magnetosphere, which deflects solar wind gusts. (Mars, which does not have a protective magnetosphere, has lost much of its atmosphere as a result of solar wind erosion.) Earth's magnetic field and the IMF come into contact at the magnetopause: a place where the magnetosphere meets the solar wind. Earth's magnetic field points north at the magnetopause. If the IMF points south -- a condition scientists call "southward Bz" -- then the IMF can partially cancel Earth's magnetic field at the point of contact.
When Bz is south, that is, opposite Earth's magnetic field, the two fields link up," explains Christopher Russell, a Professor of Geophysics and Space Physics at UCLA. "You can then follow a field line from Earth directly into the solar wind" -- or from the solar wind to Earth. South-pointing Bz's open a door through which energy from the solar wind can reach Earth's atmosphere!"
Earth's Bz has been pointing south during this entire period of poor propagation. Heavy ionization of the daylight D-layer, normally an 'absorber' of LF signals, has allowed reception of several NDB signals normally only heard at night. In fact, one of my favorite NDB propagation indicators, 25-watt YLJ in Meadow Lake, Saskatchewan, has been heard all day long on 406KHz for the past week as its signal skirts along the underside of the dense D-layer. These auroral conditions however, often enhance the path to the south Pacific and several western BCB DXers have reported excellent propagation to Australia and New Zealand in the pre-dawn hours.
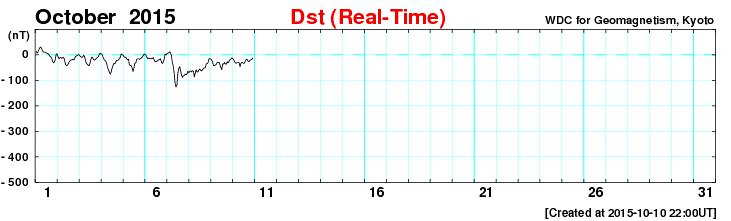
Another indicator of LF propagation disturbance is the DST or Disturbance Storm Time index. This number gives an indication of the severity of the weakness in the magnetosphere, with numbers going further and further negative as the charged particles trapped in the magnetosphere increase in numbers.
 |
| courtesy:http://wdc.kugi.kyoto-u.ac.jp/dst_realtime/presentmonth/index.html |
The DST has been having a rough ride since the beginning of the month and as these numbers grow more positive and remain there, propagation will return to normal. With late September and October often being among the best months of the year for LF propagation, and with the sun now doing its part by remaining quiet, let's hope that the earth's magnetosphere will also co-operate and seal-up those propagation-killing cracks.
Our Amazing Sun and HF Radio Signal Propagation
Space Weather. The Sun-Earth Connection. Ionospheric radio propagation. Solar storms. Coronal Mass Ejections (CMEs). Solar flares and radio blackouts. All of these topics are interrelated for the amateur radio operator, especially when the activity involves the shortwave, or high-frequency, radiowave spectrum.
Learning about space weather and radio signal propagation via the ionosphere aids you in gaining a competitive edge in radio DX contests. Want to forecast the radio propagation for the next weekend so you know whether or not you should attend to the Honey-do list, or declare a radio day?
In the last ten years, amazing technological advances have been made in heliophysics research and solar observation. These advances have catapulted the amateur radio hobbyist into a new era in which computer power and easy access to huge amounts of data assist in learning about, observing, and forecasting space weather and to gain an understanding of how space weather impacts shortwave radio propagation, aurora propagation, and so on.
I hope to start “blogging” here about space weather and the propagation of radio waves, as time allows. I hope this finds a place in your journey of exploring the Sun-Earth connection and the science of radio communication.
With that in mind, I’d like to share some pretty cool science. Even though the video material in this article are from 2010, they provide a view of our Sun with the stunning solar tsunami event:
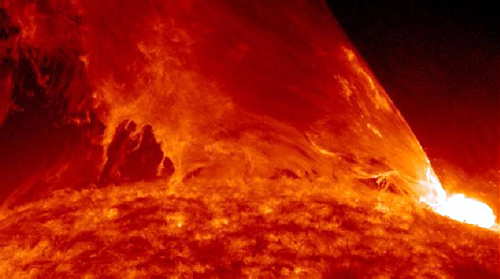
On August 1, 2010, the entire Earth-facing side of the sun erupted in a tumult of activity. There was a C3-class solar flare, a solar tsunami, multiple plasma-filled filaments of magnetism lifting off the stellar surface, large-scale shaking of the solar corona, radio bursts, a coronal mass ejection and more!
At approximately 0855 UTC on August 1, 2010, a C3.2 magnitude soft X-ray flare erupted from NOAA Active Sunspot Region 11092 (we typically shorten this by dropping the first digit: NOAA AR 1092).
At nearly the same time, a massive filament eruption occurred. Prior to the filament’s eruption, NASA’s Solar Dynamics Observatory (SDO) AIA instruments revealed an enormous plasma filament stretching across the sun’s northern hemisphere. When the solar shock wave triggered by the C3.2-class X-ray explosion plowed through this filament, it caused the filament to erupt, sending out a huge plasma cloud.
In this movie, taken by SDO AIA at several different Extreme Ultra Violet (EUV) wavelengths such as the 304- and 171-Angstrom wavelengths, a cooler shock wave can be seen emerging from the origin of the X-ray flare and sweeping across the Sun’s northern hemisphere into the filament field. The impact of this shock wave may propelled the filament into space.
This movie seems to support this analysis: Despite the approximately 400,000 kilometer distance between the flare and the filament eruption, they appear to erupt together. How can this be? Most likely they’re connected by long-range magnetic fields (remember: we cannot see these magnetic field lines unless there is plasma riding these fields).
In the following video clip, taken by SDO AIA at the 304-Angstrom wavelength, a cooler shock wave can be seen emerging from the origin of the X-ray flare and sweeping across the sun’s northern hemisphere into the filament field. The impact of this shock wave propelled the filament into space. This is in black and white because we’re capturing the EUV at the 304-Angstrom wavelength, which we cannot see. SDO does add artificial color to these images, but the raw footage is in this non-colorized view.
The followling video shows this event in the 171-Angstrom wavelength, and highlights more of the flare event:
The following related video shows the “resulting” shock wave several days later. Note that this did NOT result in anything more than a bit of aurora seen by folks living in high-latitude areas (like Norway, for instance).
This fourth video sequence (of the five in the first video shown in this article) shows a simulation model of real-time passage of the solar wind. In this segment, the plasma cloud that was ejected from this solar tsunami event is seen in the data and simulation, passing by Earth and impacting the magnetosphere. This results in the disturbance of the geomagnetic field, triggering aurora and ionospheric depressions that degrade shortwave radio wave propagation.
At about 2/3rd of the way through, UTC time stamp 1651 UTC, the shock wave hits the magnetosphere.
This is a simulation derived from satellite data of the interaction between the solar wind, the earth’s magnetosphere, and earth’s ionosphere. This triggered aurora on August 4, 2010, as the geomagnetic field became stormy (Kp was at or above 5).
While this is an amazing event, a complex series of eruptions involving most of the visible surface of the sun occurred, ejecting plasma toward the Earth, the energy that was transferred by the plasma mass that was ejected by the two eruptions (first, the slower-moving coronal mass ejection originating in the C-class X-ray flare at sunspot region 1092, and, second, the faster-moving plasma ejection originating in the filament eruption) was “moderate.” This event, especially in relationship with the Earth through the Sun-Earth connection, was rather low in energy. It did not result in any news-worthy events on Earth–no laptops were fried, no power grids failed, and the geomagnetic activity level was only moderate, with limited degradation observed on the shortwave radio spectrum.
This “Solar Tsunami” is actually categorized as a “Moreton wave”, the chromospheric signature of a large-scale solar coronal shock wave. As can be seen in this video, they are generated by solar flares. They are named for American astronomer, Gail Moreton, an observer at the Lockheed Solar Observatory in Burbank who spotted them in 1959. He discovered them in time-lapse photography of the chromosphere in the light of the Balmer alpha transition.
Moreton waves propagate at a speed of 250 to 1500 km/s (kilometers per second). A solar scientist, Yutaka Uchida, has interpreted Moreton waves as MHD fast-mode shock waves propagating in the corona. He links them to type II radio bursts, which are radio-wave discharges created when coronal mass ejections accelerate shocks.
I will be posting more of these kinds of posts, some of them explaining the interaction between space weather and the propagation of radio signals.
For live space weather and radio propagation, visit http://SunSpotWatch.com/. Be sure to subscribe to my YouTube channel: https://YouTube.com/NW7US.
The fourth video segment is used by written permission, granted to NW7US by NICT. The movie is copyright@NICT, Japan. The rest of the video is courtesy of SDO/AIA and NASA. Music is courtesy of YouTube, from their free-to-use music library. Video copyright, 2015, by Tomas Hood / NW7US. All rights reserved.