 |
 GSM phone power control and signalling
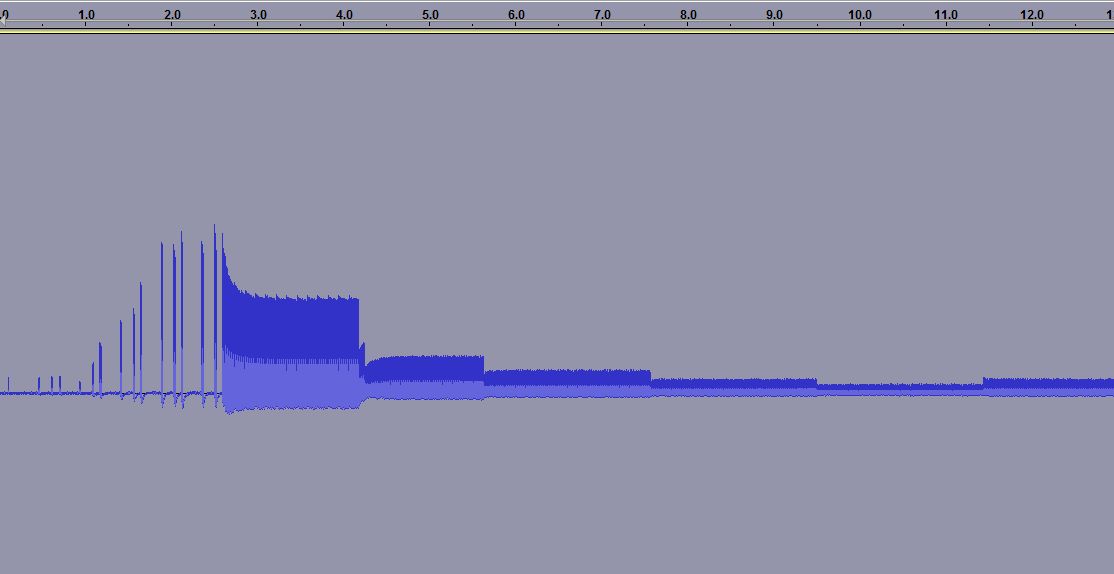
When you measure the energy out of a GSM cell phone at the moment of initiating a call, you get the picture to the right. It shows the first 15 seconds.
For the first 3.5 seconds there is the signalling between the phone and the base station. Then the connection is established, but after some time (at 4.2, 5.6, 7.5 and 9.5 seconds) one can see how the phone turns the power down, according to the commands it gets from the base station.
 The first example was for the case of a strong received signal, all bars are shown in the signal strength meter. The reduction in power, preservers battery life and as a side effect the user is exposed to a smaller amount of radiation. Interestingly, one can see that after a while there is a small adjustment of the power and it is turned up a bit (at 11.5 seconds).
 In other cases one can see a situation which follows the same pattern in time, except that the power stays at a high value. This second recording was done in my basement where GSM coverage is much poorer. Here the phone’s signal level indicator hardly shows any signal.
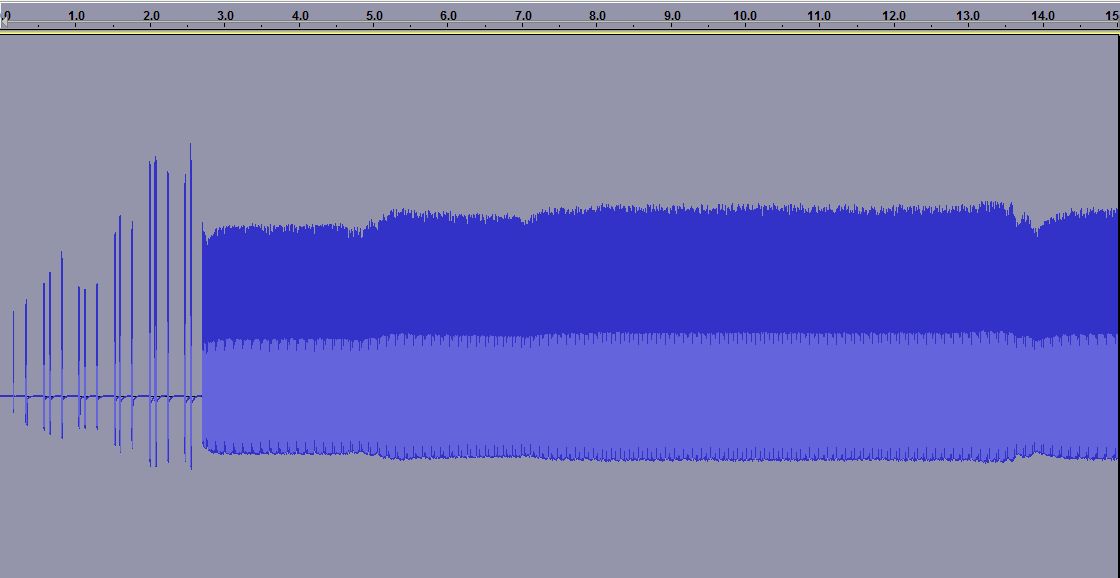

The third plot is a zoom of the previous one. Here one can see how the phone only transmits 1/8 of the time as it shares the channel with 7 other phones in a time multiplex. It is allowed to transmit every 4.6 ms and this is the reason why one often can hear a buzzing sound at 1/4.6 ms = 217 Hz in equipment which is placed close to a phone.
One also sees another frame structure, as the phone transmits 25 bursts and then breaks for one burst before continuing. Every transmission consists of 150 bits, but that is not possible to resolve with the simple setup that was used here.
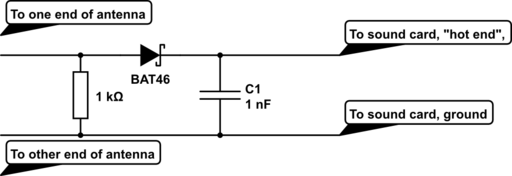
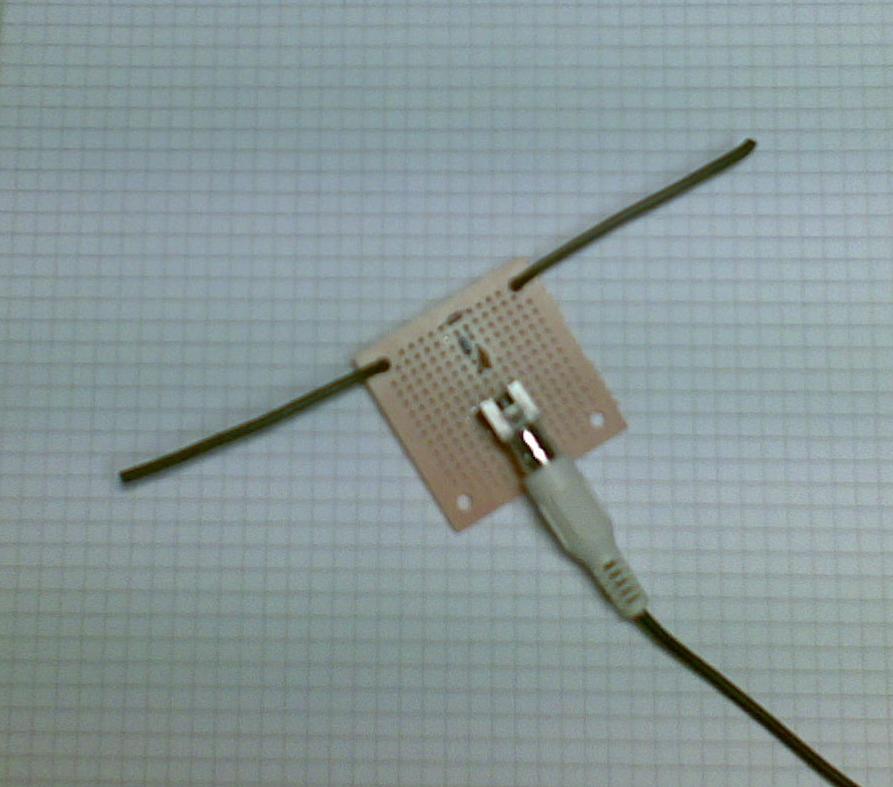 The equipment was a dipole antenna and a simple diode detector:
- A half wave dipole antenna for 950 MHz has a length of 0.5*3*108/950*106 = 15.8 cm, thus the antenna is about 2 x 8 cm (probably not very critical). The antenna was made from stiff self-supported wires.
- There is a resistor of R=1 kohm across the antenna and then a Shottky diode which acts as a detector (A Shottky diode which handles higher than 1 GHz is needed and BAT46 was used here), and finally a 1000 pF capacitor as a filter.
This post was inspired by William Andrew Steer’s “GSM phone signal analysis“.
 Ham Radio Deluxe |
 W5SWL Electronics |
 Ham Radio Prep |
 KB3IFH QSL Cards  Hip Ham Shirts  HamRadioAuctions HamRadioAuctions Reliance Antennas Reliance Antennas Enigma Shop Enigma Shop |  morseDX  Ni4L Antennas  R&L Electronics R&L Electronics antennas.us antennas.us QRV QRV |
- Matt W1MST, Managing Editor