Posts Tagged ‘sunspots’
 Progress in the Revolution: Sunspot Cycle Forecast Accuracy at Cycle 25 Peak
Blog Author Note: This is a paper written with Dr. Scott McIntosh of Lynker Space. A PDF of this article is available by clicking here. Reproduction with attribution is permitted.
Sunspots to amateur radio operators are central to daily operations, especially on the HF bands. Ever since Schwabe began counting and plotting daily observed sunspots in 1826, the leading perspective has been that sunspots follow a given, time-ordered, sinusoidal pattern of rise and fall, largely around an eleven-year cycle. The pattern of differences among cycles has been the topic of much speculation, generally without any actual empirical observation of those factors. Until recently, the sunspot cycle is virtually just a given construct based largely on daily sunspot counts, summarized to each month.
There is almost no theoretical discussion of sunspot cycle antecedents, only their effects on propagation. For instance, Nichols (2015) exclaimed, the “top experts” are unable to identify the peak or trough of the solar cycle or the timing of the transition from one cycle to another. Previous work, especially in amateur radio, has focused almost wholly on atheoretical “curve-fitting” style models of the sunspot cycle with observed sunspots gathered for almost two centuries being just a given phenomenon (see Howell and McIntosh 2022a).
With the open acknowledgement that previous predictions have not been very accurate, it is puzzling as to why better theoretical explanations have not been sought by amateur radio experts on propagation patterns (e.g. Luetzelschwab n.d.). This devotion to the theoretically unexplained eleven-year sine wave function as a sterile paradigm in the face of the empirical anomalies reduces scientific progress in understanding the sunspot cycle. Here is why.
Philosophers of science have long debated the role of prediction and explanation in scientific progress. Douglass (2009) summarizes the debate as follows. “Prediction is important because we can be surer that the scientist generating the theory has not fudged or somehow subtly made his theory inconsistent or less clearly applicable to certain contexts by virtue of some torturous, ad hoc accommodation. Prediction also allows for the generation of new (hopefully supporting) evidence. Explanation is important because it helps us think our way through to new predictions.” To make progress in the scientific understanding of the sunspot cycle, we need both theoretical understanding coupled with better predictive capability.
This was the thrust of our 2022 article series in RadCom. We published papers in the July and August issues outlining the long prevailing scientific paradigm on the sunspot cycle, noting that it was largely devoid of a formal theory predicting its rise and fall. We outlined a major challenging theoretical paradigm, led in its creation by the second author, on not only predicting Cycle 25 but offering the beginnings of why the amplitude and modulation of such cycles behave the way they do. In essence, this marked a change from mere prediction toward explanation, a cardinal sign of growth in any area of science. As we have reached the midpoint of Cycle 25, it is time to see how this argument is faring.
Competing Sunspot Cycle Paradigms
The expert panels convened by the NASA/NOAA/ISED organizations (hereafter, NNI) over the past several sunspot cycles have published their own forecasts of the next one. They have done this without any disclosure of the specific model used or the specific substantive theoretical perspective driving them. They do not disclose their methodology but state that it is the consensus opinion of an expert panel reviewing more than fifty various models submitted to them for consideration. Unlike most all peer-reviewed scientific work, the official sunspot cycle forecasts are a theoretically unexplained given resulting from an expert opinion panel whose deliberations are not open to public inspection. Their forecasts have largely failed to be very accurate when later compared to the observed sunspot numbers in the predicted cycle (see Howell and McIntosh 2022a,b for a full discussion).
The second author’s team, hereafter called the McIntosh team, developed both a theoretical foundation and empirical forecast of Cycle 25, publishing the methods they utilized and what substantive concepts shaped them. Unlike the official NNI forecasts, the McIntosh team’s work is public for all to read. We strongly encourage the readers of this paper to review our 2022 articles for details as they are indeed nuanced arguments.
Suffice it to say that the competing McIntosh paradigm emphasizes not the mere curve-fitting exercise that so many amateur radio prognosticators subscribe to in their forecasts (e.g., Cohen 2020) but two new key conceptual elements of the Sun’s dynamo. This was new ground. As we illustrate below, much of the scientific community resisted an open consideration of these ideas at the beginning.
One concept is the Terminator, a landmark event in the sunspot cycle delineating the start, end, and overlap of sunspot and magnetic activity cycles. This event does not correspond to the statistical minimum or maximum in the number of sunspots but to an underlying shift in part of the sun’s dynamo that shapes the entire cycle’s behavior. It arises from the famous Hale Magneto Cycle (Howell and McIntosh 2022a).
A second concept is the timing of the Terminator within the approximate eleven-year period. Taken from our earlier paper:
“This variability, when viewed through the lens of an insular sunspot cycle, lends itself to the anomalies noted by prominent amateur radio propagation enthusiasts. The delay in Termination frequently leads to the forecast of a poor cycle approaching, even another Maunder Minimum, by hams. More critically, the longer the time between terminators, the weaker the next cycle would be. Conversely, the shorter the time between terminator events, the stronger the next Solar Cycle would be. This is the cornerstone thesis in the new competing paradigm which successfully addresses several anomalies observed by Nichols (2015), Nichols (2016) and Luetzelschwab et al. (2021).” (Howell and McIntosh 2022a: 40).
We suggested in 2022 that the key question is whether we are indeed in a crisis stage of a paradigm shift, using the perspective of the well-established Kuhnian model of scientific revolutions (Kuhn 1962). The evidence of such a crisis state would include the following two elements. Firstly, if the competing McIntosh team’s model produces a better empirical forecast than the official NNI’s forecast does, then the theoretically-based paradigm that is a better forecast pushes toward a crisis state. Secondly, what further shapes a crisis state is if other scientists flock to the empirically-superior, theoretically-explicated one. This pattern of behavior, measured largely through citations of the competing paradigm’s exemplars, propagates the new paradigm to the field. If scientists use the competing paradigm’s exemplary papers to shape their own work, then the revolution is taking shape through the collective behavior of other scientists (Kuhn 1962).
We offer a narrated illustration in Figure 1 of the stages and processes of Kuhn’s classic explanatory model applied to these two competing paradigms. We begin on the right side of the wheel of paradigm change. Effectively, the initial “boundary maintenance,” or resistance by adherents to shift from the traditional paradigm embedded in the NASA/NOAA/ISED predictions, eventually gave way to peer reviewers’ objectivity. This occurred through reviewers and editors evaluating the increasingly massive empirical evidence based upon all sunspot cycles for which there were data constructed by the McIntosh team as they revised their initial 2012 work. This was not accomplished very quickly or very easily. As Kuhn (1962) stipulated, this is not at all unusual for a competing set of ideas which threaten the “normal science” embedded in a reigning paradigm.

Nevertheless, the existing normal science “puzzle solving” produced many anomalies in the prediction of both the amplitude and the timing of adjacent sunspot cycles. This acknowledgement that we just do not have a sufficient understanding to produce very accurate forecasts created increasing doubt in adherents to the current paradigm after facing the massive amount of evidence from the original McIntosh team’s paper.
The “boundary maintenance” from 2012 when Science Magazine rejected the initial paper on the new theory began to give way some years later. This occurred through the McIntosh team’s surprising Cycle 25 prediction of a far higher peak in sunspots than the NASA/NOAA/ISED (NNI) official predictions and why they made this forecast. Remember, the official sunspot forecast for Cycle 25 contained no explanations of how they were derived, only that a panel of experts came up with them. This “exemplar” article was published in 2020, some eight years after the initial “boundary maintenance” rejection in 2012. As these results are compared to the errors in previous expert panel forecasts by more and more scientists, this set in motion increasing collective doubt being attached to NNI’s undisclosed methods. This behavior is shown as “model drift” in Figure 1.
Once this model drift occurred after the McIntosh team’s Cycle 25 forecasts were published (2020), the empirical race was on to see which forecast would be more accurate. Modern website technology made this a monthly comparison with the release of each new count of sunspots (shown in Figure 2 below). When the second “exemplar” paper on the timing of the Terminator event appeared in 2023, this undoubtedly significantly enhanced the motivation of other scientists to read and consider the competing paradigm’s exemplars to use as a basis of their own work.
Modern technology speeds up scientific awareness of new works as compared to periodic print journal publication. So, this social network technology makes the process identified by Kuhn back in the 1960s as a “revolution” in paradigm-change an even more valid metaphor today. Should a growing number of other scientists base their published work on the exemplars of the McIntosh team, then direct “model competition” sets in. These collective acts by others in the scientific community are behaviorally manifested through increasing citations of the exemplars in the competing paradigm. If the competing paradigm’s empirical superiority continues, it is only a matter of time before the full model revolution occurs, quickly resulting in a rapid change to a new accepted paradigm. It is our assessment, as illustrated in Figure 1, that we are clearly in the model competition stage as we stand today.
Where Is Paradigm Competition at the Peak of Cycle 25?
In this paper, we evaluate the status of this potential revolution in our shared understanding of the important sunspot cycle. This is based on the two elements described above:
- Empirical superiority of the McIntosh team exemplars which introduced their paradigm to this field of science. Is the McIntosh team forecast for Cycle 25 demonstrably more accurate than those offered by the NASA/NOAA/ISED Panel of experts?
- Does the pattern of citations of the two exemplar articles published by the McIntosh team show that other scientists are adopting them? If this adoption is considerable, then the evidence compounds in favor of their new paradigm.
We now provide evidence on both elements of the issue at the approximate middle of Cycle 25. It will show that the results underscore our assessment of where things are in Figure 1.
Statistical Comparisons of the Two Cycle 25 Forecasts
Using the Austrian Space Weather Office website, we produce in Figure 2 the smoothed monthly sunspot numbers for Cycle 25 and for the two competing forecasts. We use the approximate peak time in Cycle 25 to delineate our comparisons. In other words, if this were an athletic competition, what is the score at the end of the first half of play?
In Figure 2, the vertical line is this demarcation as of August 2024 in the time series. Note that the NASA/NOAA/ISED (hereafter NNI) forecast had somewhat of a “false start,” to borrow a track-and-field metaphor, in that after their first set of numbers went public (light blue line), they released another revised forecast. This one shifted their forecast start back some six months (dark blue line). No public explanation was given by the NNI group. We use this revised NNI forecast in our analysis. The McIntosh team forecast is in the red line.

For comparative illustration, there are four other data series. The average monthly sunspot cycle number since 1750 is in green. The three observed sunspot numbers include the daily sunspots (light green line) and the key smoothed monthly sunspots in black. (There is a short series of estimated daily numbers in orange, shown after the final monthly figure.) This represents a visualization of the forecast and observed monthly sunspot numbers. The series includes 32 months of data, our approximation of the first half of Cycle 25.
In this graph, the NNI forecast does appear consistently lower than the observed monthly sunspot data after the summer months of 2022 while the McIntosh team numbers appear generally higher. The exception is near mid-cycle where the observed sunspots spike above both projections. Neither set anticipated this sharp rise in monthly sunspots. But are these two forecasts just a random walk around the observed monthly sunspots? Statisticians have addressed questions like this for some time because time series graphs are somewhat subject to various interpretations. We make statistical comparisons using standard methods for this in Figures 2 and 3.
In our 2022 RadCom paper series, we presented the McIntosh team forecast for a complementary index of solar propagation influence, the Solar Flux Index (SFI, abbreviated as f10.7). We use the NNI forecast for SFI to further compare the statistical accuracy of an atheoretical expert opinion forecast versus the theoretically-driven McIntosh team model.
We use the standard text by Theil (1966) for the analysis of forecast comparisons. One measure of the statistical accuracy of two time series is the mean absolute error (MAE) represented by the formula of

where yi and xi are the respective data values for each time series compared at the ith time interval. That sum is divided by the number of points in the time series (or n) to yield this average absolute error in numbers of monthly sunspots.
Another test that is metric-free is the mean absolute percentage error (MAPE) which is the percent version of MAE. It is the sum of the actual minus forecast divided by the actual which is averaged over the number of temporal observations:

The third consideration we make is to test for the equivalence of the two forecasts (i.e., are the different forecast series just random walks?). In this part, we use the Diebold-Mariano test or D-M (Diebold and Mariano 1995) which compares the mean difference in the squared-error or absolute error of each forecast to the observed data. This S1 test is applied to both the MAE and the MAPE (Theil 1966). The D-M S1 test can use alternate kernel densities in this computation. To safeguard our comparisons, we compute tests using both a uniform and a Bartlett kernel for the standard error estimation. Each produced similar results so the uniform kernel is presented in our results. See Diebold and Mariano (1995) for details. We used Stata 17 software for our computations using the dmariano script (StataCorp 2017).

As shown in Figure 3, the McIntosh team series results in an average monthly forecast error of 26.8 sunspots. For the NNI forecast, the average monthly error is 45.3 sunspots. The McIntosh team forecast is 18.73 sunspots more accurate on average each month. The D-M test shows that this is statistically significant: the McIntosh forecast is significantly more accurate than the NNI prediction for the first half of Cycle 25. The most recent surge in monthly sunspots during 2024 was predicted by both forecasts but the McIntosh predictions were more on track in the graph with those observations.
The second panel of Figure 3 contains the percent form (MAPE) of the forecast errors for each group’s projections. The McIntosh forecast averaged a 25.4% monthly error, lower than the NNI expert panel’s 38.3% error each month. This is a 12.9% difference between the two, reflecting a statistically more accurate forecast (p=.0000).
The Solar Flux Index (SFI) is also a critical index for propagation. It rivals the SSN in importance for daily HF operations. We use this forecast to complement the ones for monthly sunspots. The SFI graph is in Figure 4. For NNI, all monthly errors are on the high side whereas the McIntosh team’s hover on the low side of zero (i.e., matching the observed SFI). Both anticipated the rise upward during the summer months of 2024 but were off in their respective predictions. Over the first-half of Cycle 25, the McIntosh forecast averaged 25.65 Index points closer to the observed SFI (17.2 vs. 42.9). The D-M test suggests that this is a significant edge in favor of the McIntosh prediction (p= .0000).

Putting the SFI forecast errors in percent form, the lower panel illustrates a consistent over-prediction of the monthly Solar Flux Index by both. The NNI’s numbers are visibly off-base by 20 percent or greater in the graph. Some segments of the McIntosh predictions are also off by 10 to 20 percent. Overall, however, the average percent error is 27.8% for the NNI forecast and some 16.6% less for McIntosh at 11.2%. As with the MAE metric, this difference in percent form is statistically in favor of the McIntosh series (p = .0000).
In short, the McIntosh team has empirically superior forecasts for both monthly sunspots and the Solar Flux Index, two leading indices for propagation used by amateur radio and many other spheres of radio transmission practice. They are uniformly statistically significant in favor of the McIntosh theory-driven approach as compared to the expert panel forecasts from NNI.
Evidence of Paradigm Change Through Bibliometric Analysis
To examine evidence on other scientists adopting the new McIntosh team paradigm, we used methods of bibliometric citation analysis (De Bellis 2009: Chapter 8; Prabhakaran et al. 2018). This is a set of methods used to measure the impact and influence of scholarly works through the patterns and frequency of citations in various contexts (Andres 2009; Alphasoft.com n.d.). This set of metrics measures the behavior of the scientific community toward the competing paradigm which Kuhn (1962) shows is the key to paradigm change.
Traditional citation counts from the print medium tend to be much slower than scientific discovery is actually produced because of the circulation of print media (De Bellis 2009: Chapter 8). Because of this, alternative metrics were developed to measure how Internet-based tools enhance the sharing of scholarship. These tools include paper pre-print servers, online exchange of papers, and other discussion networks that are in daily use to stay abreast of the latest emerging knowledge. These “alternative metrics” including social media and online publishing are used in this part of our analysis through the Altmetric system (see Astrophysics Data System).
Following Kuhn’s approach to paradigm-change, we studied the two papers that the second author identified as the exemplars (Kuhn 1962) introducing and illustrating his team’s competing paradigm. The Astrophysics Data System (or ADS) maintained by Harvard University on behalf of the Smithsonian Astrophysical Observatory (SAO) under a NASA grant was the source of our citation analysis. The ADS system (available at (https://ui.adsabs.harvard.edu/) facilitates meta-analysis of papers in astrophysics with both bibliometric computation and visualization of results. We utilize this system to analyze citation and discussion metrics for both exemplar papers as well as all publications for the leader of this scientific team (the second author here). While we do not report a full bibliometric analysis (for example, see Prabhakaran et al. 2018), the compilation of citation metrics does suffice to gauge the initial attention and influence that this competing paradigm is having on the field of solar physics and amateur radio itself.
Figure 5 summarizes these metrics for the two exemplars. The first paper, introducing the overlapping Hale magnetic activity cycles and the relationship they have to sunspot amplitude, has 73 total citations. The bar chart on the upper right shows the trends in citations for this paper (note that 2025 is not yet fully realized). The scientific output analysis by Altmetric gives it an “attention score” of 858. This ranks number one of almost two thousand articles in the journal. Among over one-half million articles published during the same period, it ranks 813. It is in the top 5% of all research ever tracked by Altmetric.

The second exemplar introduced the Terminator timing construct, illustrating it using all the data on sunspot cycles in existence, by associating it to patterns within the 22-year Hale Cycle. This paper extended the first exemplar’s idea of potential causes of the amplitude by adding a conceptual basis for what “kick starts” the next cycle. This paper has 18 citations, moving up quickly in the year after publication as shown in the bar chart. It has an attention score thus far of 654. This article is ranked number one of almost 1,600 articles in this leading journal, Solar Physics. By comparison to about one-half million articles published in the field at the same time, it ranks 999. More importantly, it too ranks in the top 5% of all research articles scored by Altmetric.
Turning to all papers published by this scientific team’s leader, Figure 6 summarizes the same type of citation analysis. Emphasizing the period of 2020-2025 for when the competing paradigm was introduced, there are 457 papers considered in this figure. There are 5,901 citations of these papers, only a thousand of which are self-citations, necessary to build and continue a line of scholarship. The citations by other scholars are the key element for exemplar adoption. There are about two thousand citations, “normalized” to the volume of other articles published around the same time. This puts the citation patterns into the context of the scientific problem as a comparison to numbers of citations per se (see the ADS website for details). The bar chart extends the scope prior to the year 2020 to check the scholarly output by this team’s intellectual leader. The result is a steady increase in citations by other scientists in peer-reviewed papers, an indication of a very productive scholar growing in a career that is being recognized by other scientists in their own work.

The H-index is the most popular one in use for scientific comparisons. A value for H means that the author has that number of papers that are each cited by a minimum of the same number. The H-index number in Figure 6 increases prominently in 2020 to about 45, continuing through 2025. Note that an H-index value of 40 is outstanding and over 60 is exceptional (Hirsch 2005).
The read10-index reflects a decade swath of readership citations of the author’s publications. It shows the works published in 2010 (pre-paradigm introduction) and 2020 (paradigm introduction) as having the highest values, well over 100. This trend line shows the immediate interest in the author’s works over a long period of time (a decade), a sign of prominence in science.
The i100-index, however, might be the most illustrative for our purpose to ascertain how the paradigm is being adopted by others in this field of science. It illustrates the number of publications with at least 100 citations, a challenging hill to climb in science. The growth in the (purple) i100 line shows that a minimum of 100 citations for papers by McIntosh steadily increases after 2015 but especially after 2020, the year of publication for the first exemplar paper. This is also indicative of movement toward paradigm-adoption by others. The tori-index corroborates this trend as his papers become central citations by other scholars. The i10-index began to also spike when the 2020 paper came out and continued after the second exemplar appeared. This index surpasses 130, suggesting that many papers by the author have been each cited by a minimum of 10 other authors.
The bibliometric portion of our analysis shows strong evidence that the peer scientific community is heavily engaged in the competing paradigm. The two exemplars have been substantially growing in peer citations to a level of prominence. They have garnered the top attention in the respective scientific journals where they appeared, no small feat for any scientist. The H-index score shows that the lead scholar producing this new paradigm has reached an outstanding region, further evidence of movement toward direct model competition in Kuhn’s model of paradigm change.
Is There Demonstrable Progress in the Revolution?
Our goal has been to determine if there is Kuhnian movement (Kuhn 1962) toward a revolution in the long-standing paradigm for the sunspot cycle at the midpoint of Cycle 25. We identified two elements of evidence: the empirical superiority of the NNI versus the McIntosh team forecasts and the degree of scientific adoption of the competing paradigm’s exemplary papers.
Using long-established methods in forecast comparisons, our results leave little objective doubt that the theory-driven forecast by the McIntosh team is superior. For smoothed monthly sunspot counts covering the first 32 months of the Cycle, the McIntosh team forecast is 19 spots more accurate, a 13 percent and statistically significant improvement over the NNI numbers. (Note that we used the NNI’s revised forecast after they adjusted to some six months behind their original Panel’s predictions.) We included forecasts for the Solar Flux Index (f10.7) over the same time horizon. The McIntosh team’s SFI forecast is 26 index points or 17 percent more accurate. The empirical superiority, at least at mid-cycle, clearly favors the McIntosh paradigm.
The bibliometric analysis we presented on how the two exemplary papers have been received by the scientific field showed strong evidence of engagement and adoption with the competing paradigm. The overall standing of scholarship by the lead scientist was a second element surrounding this new paradigm. It too demonstrated a clear upturn in citation metrics after the publication of the two exemplar papers.
The citation numbers have been continually increasing since the first (2020) and second papers (2023) appeared in peer-reviewed journals. We noted in Figure 1 the boundary maintenance by keepers of the long-standing paradigm who rejected the original paper in 2012. It took nearly a decade (from 2012 to 2020) of continually increasing the amount of scientific evidence involving the linkages between the Hale Cycle to the sunspot cycle’s behavior to reach a successful peer-reviewed publication. With the observed rapid increase in citations of the two exemplar papers, Kuhn’s concept of a non-linear, revolutionary adoption of a competing paradigm appears indeed to fit the bibliometric results.
To underscore Kuhn’s notion, the more contemporary “attention” metrics for the two exemplars show that each is the number one ranked article in the respective publishing journal. Each is also in the top five percent of all research articles ever tracked by Altmetric. The two exemplars have clearly captured the attention of the field and the associated reporting on it challenging the status quo paradigm.
We find the bibliometric citation results to also be strong evidence that the competing paradigm is indeed now within direct model competition as illustrated in Figure 1. It may well take until the end of Cycle 25 to determine the extent that a paradigm revolution has occurred. It will depend on the continued reception of the McIntosh team’s published results as they continue their research program. This adoption would be spurred along by a continuing forecast superiority during the second half of Cycle 25. Those monthly comparative results are available on the Austrian Space Weather website for all to see.
We likened this study to that of checking the score at half-time of an athletic event. However, we must wait until this cycle is compete to render a full assessment of who wins the scientific competition. We plan to revisit this analysis at the appropriate time. The available evidence at half-time, nonetheless, clearly favors progress in the revolution involving our understanding of the critically important sunspot cycle.
References
Astrophysics Data System (ADS). Online resource [https://ui.adsabs.harvard.edu/].
Alphasoft.com n.d. “Exploring Bibliometric Methods: Citation Analysis in Research.” Online resource: https://alfasoft.com/blog/products/scientific-writing-and-publishing/exploring-bibliometric-methods-citation-analysis-in-research/.
Andres, Ana. 2009. Measuring Academic Research: How to Undertake a Bibliometric Study. Oxford: Chandos Publication.
Cohen, Nathan. February 14, 2020. “Are You Ready for the Next Solar Cycle?” https://forums.qrz.com/index.php?threads/are-you-ready-for-the-next-solar-cycle.692443/.
De Bellis, Nicola. Bibliometrics and Citation Analysis: From the Science Citation Index to Cybermetrics. 2009. Lanham MD: Scarecrow Press.
Diebold, Francis and Roberto Mariano, “Comparing Predictive Accuracy,” Journal of Business and Economic Statistics, 13:3, 253-263, 1995.
Douglas HE. “Reintroducing Prediction to Explanation.” Philosophy of Science. 2009;76(4):444-463. doi:10.1086/648111).
Hirsch JE. (2005) An index to quantify an individual’s scientific research output. PNAS 102(46):16569–72.
Howell, Frank M. and Scott W. McIntosh. 2022a. “On the Cusp of a Scientific Revolution: Part I.” RadCom July: 36-43.
Howell, Frank M. and Scott W. McIntosh. 2022b. “On the Cusp of a Scientific Revolution: Part II.” RadCom August: 76-77.
Kuhn, Thomas. 1962. The Structure of Scientific Revolutions. University of Chicago Press.
Luetzelschwab, Carl. n.d. “A Look at All Twenty Three Solar Cycles.” Retrieved from http://k9la.us/A_Look_at_All_Twenty_Three_Solar_Cycles.pdf
McIntosh, Scott W., Sandra Chapman, Robert J. Leamon, Ricky Egeland & Nicholas W. Watkins. “Overlapping Magnetic Activity Cycles and the Sunspot Number: Forecasting Sunspot Cycle 25 Amplitude.” Frontiers in Astronomy and Space Sciences. 295 (12), December 2020.
Nichols, Eric P. 2015. Propagation and Radio Science: Exploring the Magic of Wireless Communication. Newington, CT: American Radio Relay League.
Prabhakaran, T., Lathabai, H.H., George, S. et al. Towards prediction of paradigm shifts from scientific literature. Scientometrics 117, 1611–1644 (2018). https://doi.org/10.1007/s11192-018-2931-3.
StataCorp. 2021. Stata: Release 17. College Station, TX.
Theil, Henri. 1966. Applied Economic Forecasting. Chicago: Rand McNally.
Livestream: Space WX, Propagation, Amateur Radio – Sundays

Join us every Sunday for Livestream at 21:15 UTC
Vacuum Tubes – Electronics at Work: 1943 Educational Film
In the classic educational film titled “Electronics at Work,” produced by Westinghouse in 1943, viewers are introduced to the fascinating world of vacuum tubes. This film highlights the crucial role these devices played in both military and commercial sectors, including radio telecommunications, radar, and various industrial applications. The narrative suggests that vacuum tubes provided the United States with a significant advantage during World War II, particularly in enhancing communication and technology.
The Continuing Relevance of Vacuum Tubes
Despite advances in technology, vacuum tubes remain in use today for several applications, including:
– Transmitting radios
– Medical devices
– Audio amplification systems
– High-frequency applications
Understanding Vacuum Tubes
The film outlines the six basic functions of electronic tubes and illustrates how each type is employed in different industrial and military contexts.
[embedyt] https://www.youtube.com/watch?v=ZJ6rN7WEjbc[/embedyt]
Structure of a Vacuum Tube
A vacuum tube typically consists of two or more electrodes housed within a vacuum inside an airtight enclosure. Key features include:
– Electrode Types: Most vacuum tubes have glass envelopes, although some utilize ceramic or metal casings with insulating bases.
– Leads and Sockets: The electrodes connect to leads that pass through the envelope via an airtight seal. These leads often take the form of pins, allowing for easy replacement in a tube socket, as tubes were a common point of failure in electronic devices.
– Capacitive Design: Some tubes feature a top cap on the electrode to minimize interelectrode capacitance, enhancing high-frequency performance and maintaining safety by separating high voltages.
The Evolution of Vacuum Tubes
The earliest vacuum tubes emerged from incandescent light bulbs, which contained a heated filament sealed in an evacuated glass envelope. When heated, the filament releases electrons into the vacuum through a process known as thermionic emission.
– Electrode Functionality: A second electrode, known as the anode or plate, attracts these electrons if it holds a more positive voltage. This mechanism results in a flow of electrons from the filament (cathode) to the plate, creating an electric field due to the potential difference between them.
– Diode Function: A vacuum tube with two electrodes is termed a diode, which functions as a rectifier. Diodes allow current to flow in only one direction, converting alternating current (AC) into pulsating direct current (DC). This technology is widely used in DC power supplies and in demodulating amplitude-modulated (AM) radio signals.
Film Availability and Production Details
This film is available in the public domain under Creative Commons, and it can be accessed through the Library of Congress Prelinger Archives. The film has been edited and converted to HD quality for better viewing. Introductory and closing music is provided by Nero 10, with commercial use rights granted.
This film not only serves as an educational tool but also highlights the enduring legacy of vacuum tube technology in the realm of electronics, illustrating its significant contributions to both past and present technological advancements.
Please subscribe to my YouTube Channel: https://YouTube.com/NW7US
Also, please click on the bell, to enable alerts so that when I post a new video, you will be notified. By subscribing and making sure that the bell (alert) notification is set to ALL, you will be kept in the loop for new videos and more.
Visiting Again with the Denby Dale Amateur Radio Society
Have you ever been invited to visit with a group of radio amateurs and just felt like you’d dropped in at home? I’ve had the pleasure of that a few times. One of those groups is the Denby Dale Amateur Radio Society in England. Their Chairperson is Nick Bradley G4IWO. He’s invited me to natter about with the DDARS several times over the past couple of years. Last week, I spoke to them about my RadCom articles with Dr. Scott McIntosh that appeared this summer.
The talk is now on their Youtube Channel below. I hope they get back soon to meeting in Pie Hall, where they are served pie and peas. After all, Denby Dale is the home of the world’s largest meat pie! If the pie is as welcoming as the group that typically meets there, it’s very good indeed!
Part 2 of the “Revolution” Article on the Sunspot Cycle in August Issue of RadCom
RadCom’s August issue contains Part 2 of my article with Dr. Scott McIntosh on the potential scientific revolution in understanding the cycle of Sunspots. This part contains more insight into the McIntosh team’s path-breaking theory of the Terminator Event and the factors that shape Cycle 25. The comparison of competing paradigms—here from the NASA/NOAA Panel’s declaration of a Cycle 25 prediction without any disclosure of methods or theory used versus the McIntosh team’s peer-reviewed papers—is likened to the one a century ago between the classic Newtonian view and the upstart Einstein’s Theory of Relativity.
Who now reads Newton for science, except for history?
Howell and McIntosh, RadCom, August 2022
As the history of science shows, it was the upstart Einstein challenging the classic paradigm of Newton who brought the newspaper headlines, “Revolution in Science.” We can watch monthly updates of this modern comparison in a special website discussed in our August article.
This part of our paper contains the forecast of the Sunspot numbers and the Solar Flux Index over Cycle 25. See the August issue of RadCom, the journal of the Radio Society of Great Britain.

“Revolutionary” Cover Story in RadCom July 2022
I’ve mentioned this work in various episodes of the ICQ Podcast as well as on social media in my Twitter account and now it’s published. Dr. Scott McIntosh and I collaborated since my original feature interview with him in Episode 332 of the the ICQ Podcast back in 2020. He paid a return visit with me for a follow-up feature interview by Martin Butler M1MRB in Episode 377 recently. The article by Howell and McIntosh, “On the Cusp of A Scientific Revolution,” is the cover story in RadCom, the magazine published by the Radio Society of Great Britain. Here’s the cover with a very nice photo of the sun and the ESA Solo satellite facing it. Kevin M6CYB, layout and design specialist at RadCom, put this cover together using resources from the ESAATG Media Lab, for Elaine Richards G4LFM, Editor of RadCom.

Elaine G4LFM is a delightful Editor to work with! As my readers no doubt know from previous posts on this blog, I served as Editor-in-Chief for Springer Media, a very large scientific publisher based in The Netherlands. So I’veb oo that side of the editorial desk for both journal articles and book manuscripts. Moreover, the untimely loss of her Technical Editor, Giles Read G1MFG (sk), added to her workload recently. But she handled all of that, plus her pending retirement, with the utmost aplomb. There’s no muss, no fuss in submitting a paper. No waiting for 6-8 weeks or more for the Editor to “maybe” get back to you. I highly recommend RadCom as a potential outlet for your work.
This is Part 1 of a lengthy and detailed paper. Part 2 is scheduled to appear next month, in the August issue. It’s not an elevator speech so be prepared to read it like you would read a schematic diagram. We think it will be worth your time.
There are some other great articles in this month’s edition of RadCom. Here’s a screen shot of the Table of Contents so you can take a look at both the regular columnists and contributions by authors such as Scott and me.

So what’s all of this about?
We place the current situation of significantly different Cycle 25 predictions of sunspots into the framework of how science works. I’m not speaking of which test tube or microscopic plate to use, for that involves the mechanics of each specific scientific field (Yep, I realize just how outdated those examples are but you get my point.) How does “science” as an institution work?
This diagram illustrates how Thomas Kuhn depicted “scientific revolutions” in paradigm change:

We argue that understanding the solar cycle is in the model competition stage of this diagram.
Dr. McIntosh is the solar physicist. I’m not. But I taught philosophy of science, research design and modeling various scientific phenomena in obscurely named course titles like Structural Equation Models with Latent Variables and Spatial Analysis. I also edited and created a few journals in my career, too. Moreover, I’ve worked for NASA in their Commercial Remote Sensing Program at Stennis Space Center and managed peer-review panels in Washington, DC. So I’ve witnessed how this works in several fields of science, especially when I’ve been invited to reconcile disputes in funding or peer-reviews (e.g., integrated pest management).
When I interviewed Scott in 2020 for the ICQ Podcast, it was clear as a bell to me that the issues he and his colleagues were having in getting some of this “revolutionary” work published in solar physics outlets reflected a clash of theoretical paradigms. Pure and simple. It represents a competing paradigm attacking many of the anomalous findings (or lack thereof) involving the amplitude and cycle transition. Afterwards, he asked me to read a draft of a key paper establishing the linkages between the Hale Magnetic Cycle and the Solar Cycle in which I made voluminous comments and suggestions on the data, modes of analysis, and how to deal effectively with reviewers as a former editor. I’m sure I made a number of “rookie mistake” comments since I’m not a solar physicist, lol. But he was very kind to not mention those, only suggesting other sources for me to read and review.
When it was published, I was greatly touched to have received an acknowledgement for my impact on the final paper (see Scott W. McIntosh et al. (2020). Deciphering Solar Magnetic Activity: 140 Years of the ‘Extended Solar Cycle’ – Mapping the Hale Cycle. Solar Physics (2021) 296:189 (https://doi.org/10.1007/s11207-021-01938-7). Considering that this could be a seminal paper among those published by the McIntosh team that might precipitate a paradigmatic revolution in our understanding of the solar cycle and sunspot amplitude and the transition from one cycle to another, it’s an even greater honor to receive this acknowledgement outside my own field of science.
Scott and I have developed a close collaborative relationship and I’ve learned a lot from him and his published work. He is just a delight in “elmering” me about solar physics. But have no confusion: he’s the solar physicist and I’m the statistician and philosopher of science. We hope that through this collaborative paper, his team’s theory, models and data reach the wide audience that is amateur radio. We hams are one of the significant consumers of this slice of solar physics. But we decided that my expertise would help identify the paradigm boundaries of Scott’s new paradigm as well as some other facets of communicating outside of solar physics. Perhaps even within solar physics, too.
As we “shockingly” disclose in RadCom, the current NASA/NOAA “official” predictions for Cycle 25 do not release any of their methods or assessments to the public. (Insert record scratch here.) Yet, their forecasts are decidedly lower in amplitude than those published under peer-review by my co-author, Scott McIntosh, and his team of collaborative scientists. Amateur operators, however, view the official NASA-NOAA Panel predictions over the past several solar cycles are the Holy Grail source of sunspot activity. We’ve seen this movie before:
While Scott has published beaucoup papers documenting his team’s explicit theory of how these aspects of the sunspot cycle (as amateurs like to call it) work together, our RadCom article attempts to lay it out in comparison to those “official” predictions by the NASA-NOAA Panel. One team will ultimately be proven to be more correct as Cycle 25 matures; the one based upon Panel votes of “expert opinion” or the one based upon a peer-reviewed alternative paradigm.
Those who see SSNs as the critical daily index shaping their amateur radio operations will want to see which team is “right.” To facilitate this, there is a website where the NASA-NOAA predictions, the McIntosh team predictions, the average SSN over the horizon, and the observed SSNs for each month are published in clearly annotated graphs for all to see. No “smoke-filled rooms” where just a professional opinion is offered, but observable empirical data, updated monthly.
Hmm. I wonder whether I’d trust a team of physicians who just met in a conference room and voted to see if I had cancer (which I did in 2005) or a team of physicians who took X-Rays, MRI’s, blood samples and so forth to aid in their diagnosis and treatment plan. Which one do you think is more worthy of your trust? Well, it’s largely up to the observed SSNs and the two sets of predictions, even though one is formally devoid of a stated theory, isn’t it?
Here’s the money graph here:

As the reader can see, the McIntosh predictions (in black) are decidedly closer than the “official” NASA/NOAA/ISES Panel’s predictions (two different blue lines) to the actual observed smoothed sunspot numbers as of July 2022 (green lines).
This is not unlike how the educated world awaited a specific set of photographic plates from an eclipse to determine whether the famous Sir Isaac Newton or the (then) young, whipper-snapper Albert Einstein was correct about Relativity. That was how the Newton-Einstein debate was largely resolved. The McIntosh team has put it’s scientific reputation on the line with observable data, which is how science has moved over the centuries since its emergence in modern societies.
You can find out more about Dr. McIntosh at NCAR (his research center), on Twitter, or by listening to the two podcast episodes I noted above on the ICQ Podcast website. In addition, Scott has given many talks to amateur radio clubs on this team’s work. Youtube is your friend here. I’m already scheduled for late July to talk about this RadCom article to the Denby Dale Club. If you’d like a talk on this to your club, feel free to email me and I’ll do my best to accommodate you. I’m good on QRZ.
Solar Cycle 25’s Fast Progress
Blog readers may remember my previous blog discussing a more optimistic prognosis for the just-starting solar Cycle 25. It described the then recently-published scientific paper whose conclusion was rather startling:
"... we deduce that Sunspot Cycle 25 could have a magnitude that rivals the top few since records began."
The scientific paper described the exact opposite of any and all predictions that I have read or have seen referenced, and at the time of publication, was surely a bold and risky claim for the paper's authors. (1)
An over-simplification of the methodologies used to develop their prediction describes the study of the complex relationship involving the Sun's 22-year (Hale) magnetic cycle, the end points of adjoining cycles called 'terminations' and sunspot production, to predict the eventual strength of the new cycle.
The end of the cycle or ‘terminator’ event plays a significant role in the new cycle’s progress, as the shorter the separation between adjoining terminators, the stronger the next cycle will be. The possibilities of Cycle 25 being a truly strong one depends upon (according to the paper) a terminator event occuring sometime before the end of 2020.
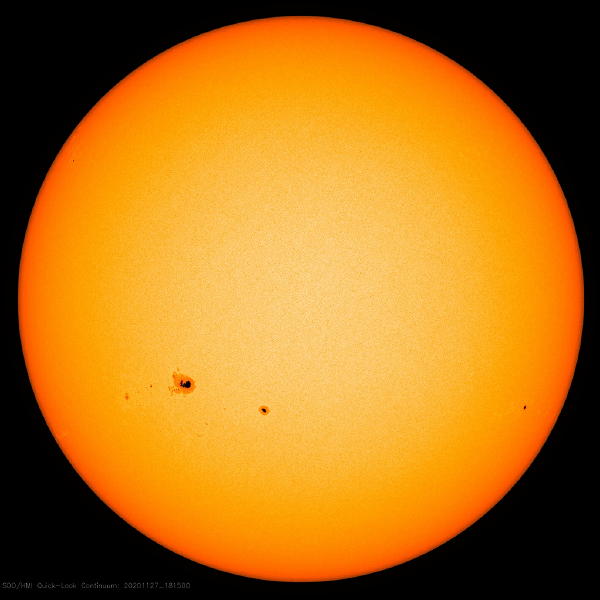
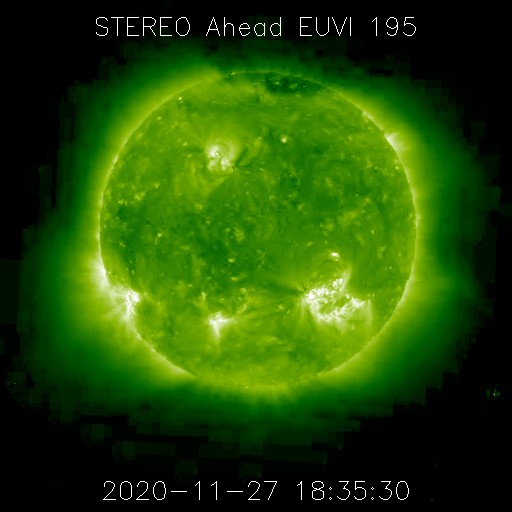
Although there has been no official announcement as of yet, it appears that the termination may be presently occuring. Again following the paper, the termination event will produce a sudden and marked upturn in the growth of solar activity and will in fact, switch on suddenly within one solar rotation. As startling as this sounds, it appears to be exactly what is happening on the Sun right now.
 |
| courtesy: nasa.gov |
Just one week ago, the Sun’s solar flux stood at ~79 sfu (Solar Flux Units) but has climbed rapidly to 110. With several active sunspot regions on the earth-facing side of the Sun and several actively flaring groups about to rotate into view on the backside, it seems as if this sudden growth may be sustainable.
What is particularly encouraging is the activity level of the earth-side spots as well as the ones coming around, with several C and B-class flares continuing to push the flux higher.
Although it will likely slow and subside, a key indicator of future strength will be the time that it takes to recover and climb again.
Another interesting gauge of a new cycle’s possible future strength is the number of months needed to reach an average monthly SFI of ‘90’. Strong cycles tend to climb early and rapidly, in order to reach their lofty heights.
The strongest cycle on record was Cycle 19, the grandaddy of them all.
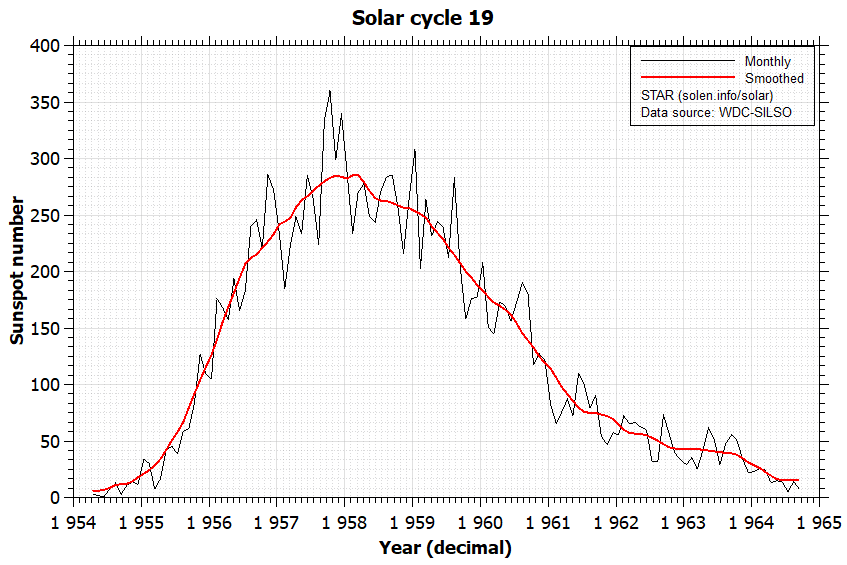 |
| courtesy: http://www.solen.info/solar/ |
Compared to anything before or after, it was a magnificent monster of a cycle for ham radio. Cycle 19 reached the magic SFI 90 value in only 18 months ... Cycle 25 has reached this same point in just 12 months! If this is indeed an accurate marker for cycle strength, and there is no reason to believe otherwise, then maybe we should all hold onto our hats.
We’ve been told for several years by those who know these things, that Cycle 25 would likely be a repeat of the poorly-performing Cycle 24, or even weaker. I think one thing that can now be reasonably surmised is that this isn't another Cycle 24! We should know shortly, if Cycle 25 is the real thing or not, once the termination event has been confirmed.
In the meantime, enjoy the wide open strong signal opportunities now playing on 10m ... the band is back once again and in fine form ... way earlier than anyone ever expected!
(1) Scott W. McIntosh (1), Sandra C. Chapman (2), Robert J. Leamon (3,4), Ricky Egeland (1), and Nicholas W. Watkins (2,5,6)
1 National Center for Atmospheric Research, P.O. Box 3000, Boulder, CO 80307, USA.
2 Centre for Fusion, Space and Astrophysics, University of Warwick, Coventry CV4 7AL, UK
3 University of Maryland, Department of Astronomy, College Park, MD 20742, USA.
4 NASA Goddard Space Flight Center, Code 672, Greenbelt, MD 20771, USA.
5 Centre for the Analysis of Time Series, London School of Economics and Political Science, London WC2A 2AZ, UK
6 School of Engineering and Innovation, STEM Faculty, The Open University, Milton Keynes, UK