 Grab me a callsign
While I wait for a correctly programmed chip for my QRSS keyer kit I thought I would investigate the receive side of QRSS beaconing. It’s no good transmitting if nobody receives, and unlike WSPR every transmitter isn’t automatically a receiver during its off periods. This is a mode where you need to give as well as take, to receive in order to be heard, otherwise you can’t complain if no-one tells you that they heard you.
QRSS signals are decoded visually using a spectrograph, a waterfall display similar to that found in digital mode software. However, you can’t use a digimode software waterfall for two reasons: it moves too quickly – to capture a full callsign in QRSS you need to be able to see at least a couple of minutes worth of transmission – and it scrolls down vertically so trying to read calls would give you a crick in your neck!
Fortunately there are programs that have been specially written for just this application – and they are free so there is nothing to stop you trying them. The most popular program for Windows appears to be Argo. However there is alternative called QRSS VD by Scott Harden (the odd choice of name becomes clear when you realized that Scott’s call is AJ4VD.) QRSS VD has one problem: it is a CPU hog. On my fairly modern shack PC it runs at about 50% CPU utilization. For that reason, you might have no alternative but to use Argo. But if you can run QRSS VD it has some nice features that add to the enjoyment of this aspect of the hobby.
QRSS VD includes three programs: a Spectrograph, a Viewer and a Grabber. The QRSS VD Grabber automatically captures the live waterfall and creates images suitable for uploading to a website so others can see whether you are receiving their signals. It doesn’t have any way of automatically uploading the images to the web server, though. It’s really for people who want to run an online grabber, which is only worth doing if you are going to run it regularly. I don’t have enough radios and antennas to do that so I probably won’t investigate this feature further.
QRSS VD Spectrograph is the program that displays in real-time what you are receiving. It has no obvious user interface – you have to right-click the window and then you will get a menu of options. One option lets you select the sound card that is connected to your radio. Another is for setting the frequency. The main settings option determines the size of the window and the maximum and minimum frequencies that are displayed.
There is also an option to save these settings. If you don’t, you will have to set them all over again the next time you start the program. Finally there is the Resume option which you must click to start the spectrum display working.
Most QRSS activity takes place on the 30m band, in the first 100Hz above 10.140 MHz. This is just below the 200Hz used by WSPR, which is itself just below the region where PSK31 operation takes place.
To start receiving QRSS, set your receiver to USB mode and tune it to 10.139.000. If your rig has a DATA mode that is USB you can use that. Don’t be tempted to use the CW mode – most rigs add an offset to the displayed frequency so it shows the frequency in the centre of the CW filter passband, and some rigs use LSB for CW, so finding the right spot gets confusing.
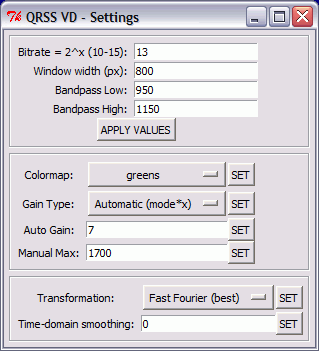
Select the sound card in QRSS VD, then set up the settings dialog. The window width in pixels can be whatever suits your screen size. The bandpass low and high settings define the height of the window, the minimum and maximum audio frequencies displayed on the spectrograph. With the radio on 10.139.000 USB, signals in the QRSS sub-band will be heard at audio frequencies of 1000 to 1100Hz. I set the low and high values to 950 and 1150Hz respectively to give a 50Hz margin on either side. (Note: if you aren’t sure of your receiver’s accurate calibration you might want to choose a wider margin initially because you could miss the QRSS band entirely of it is more than 100Hz out.) The other values on this dialog are all defaults.
[If you are interested in receiving WSPR as well, you could tune the radio to 10.138.700 and enter low and high values of 1250 and 1450Hz. Then you could run WSPR and QRSS VD on 30m simultaneously.]
Right-click the spectrograph window, click Resume and the screen should start scrolling to the left and filling with received signals. Conditions are pretty poor at the moment so there isn’t much to see on the screenshot I made, but when I first tried this program I immediately received a trace of a signal from Steve, G0XAR who coincidentally is the producer, together with Hans G0UPL, of the QRSS beacon kit I just bought. I don’t know if he was using one of these kits but it was producing a heck of a signal. (Ignore the frequency shown, this was received using my K2 whose calibration is considerably out.)
What’s nice about the QRSS VD software is that you don’t have to watch the output in real time to capture signals and it is simple to produce nicely formatted records of signals received like the one above. Every few minutes the spectrograph dumps a bitmap file in the program’s Output folder. When you want to see what you caught you start up the QRSS VD Viewer, select a group of bitmaps to view and it will stitch them into a seamless time continuum. You can then scroll through from start to finish looking for the traces of QRSS signals.
When you find one, you can capture a region of the spectrograph by clicking to specify the top left and bottom right of the desired area. You can even specify a custom caption. The selected area is then copied to the Windows clipboard and pasted into your default bitmap viewer ready for you to save in a format of your choosing (for example, as a JPG file.)
Why would you want to do this? As I mentioned at the beginning, there is no way of finding out how far your signals got (apart from a handful of online grabbers) unless someone sends you a signal report, so if you receive someone’s beacon you should send them a report too. The only way to do this is to look up their email address at qrz.com and send them an email. A picture is worth a thousand words, so it’s nice to be able to send a screen grab of their actual signal as an attachment to the email.
If my initial experience is anything to go by, this personalized way of sending signal reports makes for a very friendly aspect to the hobby. I sent this capture (above) of a beacon from IQ2DP with an emailed report. This morning I received a nice reply from Teo I2RIT thanking me for the report and telling me all about the beacon, which is made from junk box parts and runs well under 100mW into a ground plane made of scrap aluminium tubing. He also sent a link to an article about it. The article is in Italian but here is a translation. If you’ve read this far then you will probably find it interesting. Yet another facet to our amazingly varied radio hobby.














Beautiful article! This inspires me to further development of qrss vd! So cool. I’m glad someone else found qrss vd useful! Check out http://ham.w4dfu.ufl.edu:8080 for a live example with web history example