 |
 Getting the plot
A few years ago I read about a program called Radio Mobile which was supposed to be able to plot maps showing your VHF or UHF station coverage using actual terrain data. I downloaded it but couldn’t figure out how to get it to work so I gave up. A few days ago someone mentioned that it is possible to hook the program into an APRS server so I thought that I would try again. I was given a hint that for UK users the G3TVU Quick Start package was the easiest way to get Radio Mobile going.
The default setup is for a location in the Derbyshire Peak District so I followed the instructions on Changing Location to try to create maps centered on G4ILO. I got as far as producing an elevation map but was then baffled by the sentence: “Which can then be ‘Merged/Copy’ with a road map and ‘Kept in new picture’ to produce.”
James VE6SRV came to my assistance with an explanation in English: “On the menu select EDIT then in the drop down menu select MERGE PICTURES… F7. You’ll get a dialog box opened up. It will have a list of various sources on the left, detailed choices about the source in the middle and operation controls on the right.Try picking OSM, and then clicking DRAW. After the merge is complete, you’ll be asked how you want to keep the resulting image, or to discard it. The four options equate to SAVE, SAVE AS, LET ME LOOK AT IT FOR NOW, and TOSS IT. If you chose copy, the OSM tiles will overwrite the relief map. ADD, MULTIPLY, and BITWISE are 3 different methods of merging the shaded relief map with the OSM tiles. Depending upon the colours, and the type of output you want, you’ll need to play a bit with the choices to see how it looks for you. You can also play with contrast and brightness sliders to try and get the output just how you like it.” This was just what I needed, and after a bit of experimentation I soon had a road map of my area merged with the relief map showing the mountains.
The next step was to try to plot the coverage of my station on the map. I believe the default setup had a dummy base, mobile and hand-held station predefined but they were now outside my area and in any case I must have deleted them. Creating a “unit” for my own station was simple enough, but when I selected one of the tools to plot coverage the Draw button was disabled. Eventually I worked out that you have to have at least two stations (“units”) defined and they must both be members of the same network. The program will then plot the coverage for your station as received by a station of the same type as the other one.
I thought the coverage plots were rather optimistic judging by experience so I had to change some of the parameters and choose the “worst case” to get a plot that looked reasonable. This being VHF, it’s possible that the fact of my antenna being located in the attic could result in some degradation of the signal. I felt the default colouring of green for 3dB over noise or better and yellow for 3dB below noise to 3dB above didn’t give a realistic picture so I changed the colouring so that green depicts 10dB or more over noise and yellow shows between 0 and 10dB.
The first plot shows a wide area view:
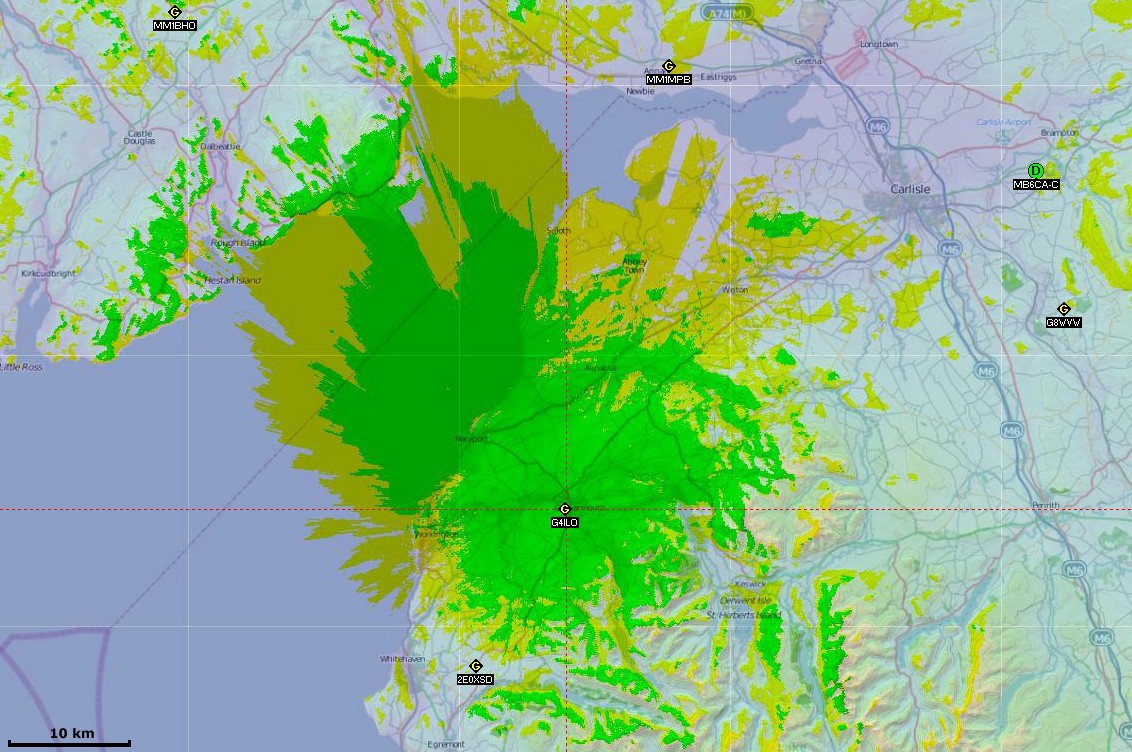
Click to see the map full-sized. I did a second plot at a larger scale to show the local coverage in more detail:

The plot shows really clearly how my VHF range is limited by the surrounding hills.
Connecting Radio Mobile to an APRS server has limited use. The program doesn’t seem to handle objects very well so for example the GB3CA object put out by MM1MPB shows as MM1MPB and moves that station’s position. But it is a useful way to get other local stations into the system instead of manually entering their details.
The objects sent out by WOTA to show the position of a Wainwrights On The Air activation are shown as WOTA not the name of the object. The Radio Link option can be used to plot the path between two stations and estimate the received signal strength, as in this example showing the path between me and Phil G4OBK/P on the summit of Seatallan.
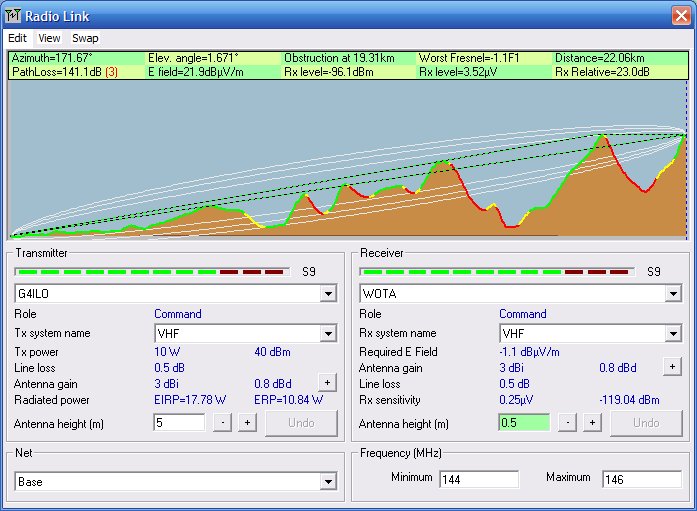
The estimated S9 signal strength is somewhat more than I actually received from Phil and I was running 50W not 10W. As mentioned earlier my antenna gain is also downrated over reality to try to get a more realistic picture.
Radio Mobile is a clever piece of software and it was interesting to play with it. It was quite hard work to get going, but it was useful to see how the nearby hills affect my VHF coverage.
One Response to “Getting the plot”
 Ham Radio Deluxe |
 W5SWL Electronics |
 Ham Radio Prep |
 KB3IFH QSL Cards  Hip Ham Shirts  HamRadioAuctions HamRadioAuctions Reliance Antennas Reliance Antennas Enigma Shop Enigma Shop |  morseDX  Ni4L Antennas  R&L Electronics R&L Electronics antennas.us antennas.us QRV QRV |
- Matt W1MST, Managing Editor

There’s something similar for Android phones called “Cloud RF”. You can get upto 15km range on the free version and unto 150km if you’re willing to put your hand in your pocket…!